---
title: "Air in Cities: What Clean Cities’ Ranking Actually Measures"
url: "https://blog.sf-paris.dev/en/clean-cities-air-quality-ranking-milan-turin/"
lang: "en"
translations:
it: "https://blog.sf-paris.dev/classifica-clean-cities-aria-citta-milano-torino/"
author: "Simone Flavio"
published: "2026-11-18T09:30:00+00:00"
updated: "2026-11-17T12:51:32+00:00"
categories:
- "News"
tags:
- "Air quality"
- "Clean Cities"
- "EU directive"
- "Pollution"
summary: "According to Clean Cities, Milan is 36th and Turin 37th of 40 European cities. Clean Cities uses both today’s and the 2030 air limits: here is how it builds the score."
reading_time_minutes: 10
word_count: 2252
---
# Air in Cities: What Clean Cities’ Ranking Actually Measures
On the morning of November 17, 2026, Sky TG24 ran the headline “Milan and Turin near the bottom in Europe.” In Clean Cities’ ranking of 40 European cities, Milan is 36th and Turin 37th.
Are Milan and Turin really near the bottom for air? They are near the bottom only in part. Clean Cities’ score blends four indicators, and in the report’s table Milan and Turin rank high on traffic measures and low on average pollutant concentration. Sky writes that the main difference among Italian cities comes from pollution levels and from compliance with the limits.
In short
According to the City Ranking 2026 by Clean Cities, a campaign group, Milan is 36th and Turin 37th of 40 European cities. The score adds up four indicators: average pollutant concentration counts for half, while compliance with limits, reduction since 2016, and traffic measures count for one sixth each. The first indicator starts from today’s limits in the European directive; the second indicator uses the revised limits, which apply from 2030. EU member states must transpose directive (EU) 2024/2881 into national law by December 11, 2026. The figures come from Clean Cities’ report: here they have not been checked against the European Environment Agency’s original data.
## Who made the ranking?
The ranking is called “City Ranking 2026: Free to Breathe” and comes from Clean Cities, which the report says is hosted by Transport & Environment (T&E) and which Sky describes as a European coalition of more than 150 non-governmental organizations. Clean Cities is not an oversight body: it runs a campaign, and the report came out together with two petitions addressed to the mayors of Milan and Turin. Being a campaign is not a flaw, but it is worth knowing before reading the numbers.
The data for the first three indicators come from the annual statistics of the European Environment Agency (EEA), with a data cut-off of October 2, 2026; Clean Cities compiled the fourth indicator from public sources. The report warns, and Sky repeats, that the Agency’s 2025 data are still under verification and may change slightly. For Milan the report uses “Greater Milan,” the metropolitan area defined by the Agency; for Turin, Rome, Florence, and Bologna the report uses the municipalities, so the Italian cities are not entirely comparable on equal terms.
The 40 cities run from Copenhagen, in first place, with 91.3% of the maximum score, to Athens, in last place, with 23.0%.
## How does Clean Cities build the score?
Each city gets a mark from 0 to 10 on four indicators:
- the first indicator is the average concentration in 2023-2025 of nitrogen dioxide (NO2) and fine particulate matter (PM2.5): zero points at the annual limit currently in force, 40 micrograms per cubic meter (µg/m³) for nitrogen dioxide and 25 for fine particulates; ten points at the level of the World Health Organization’s guidelines, 10 and 5 according to the report;
- the second indicator is compliance with the four revised limits of the directive, those of 2030: two for nitrogen dioxide and two for fine particulates, annual and daily, with 2.5 points for each limit met;
- the third indicator is the reduction in concentrations between 2016-18 and 2023-25;
- the fourth indicator is traffic measures: low- or zero-emission zones, electric buses, protected bike lanes, school streets.
The first indicator counts three times as much as each of the other three: current levels, Clean Cities writes, matter most for the health of people who live in cities. The weights are therefore 3, 1, 1, and 1, for a maximum of 60 points, then converted to a percentage. It follows that traffic measures account for one sixth of the score, and the three components on air account for five sixths of it.
The first three indicators are numbers taken from a public database. The fourth indicator is compiled by the association from public sources: it says whether the measures exist, not how well they work.
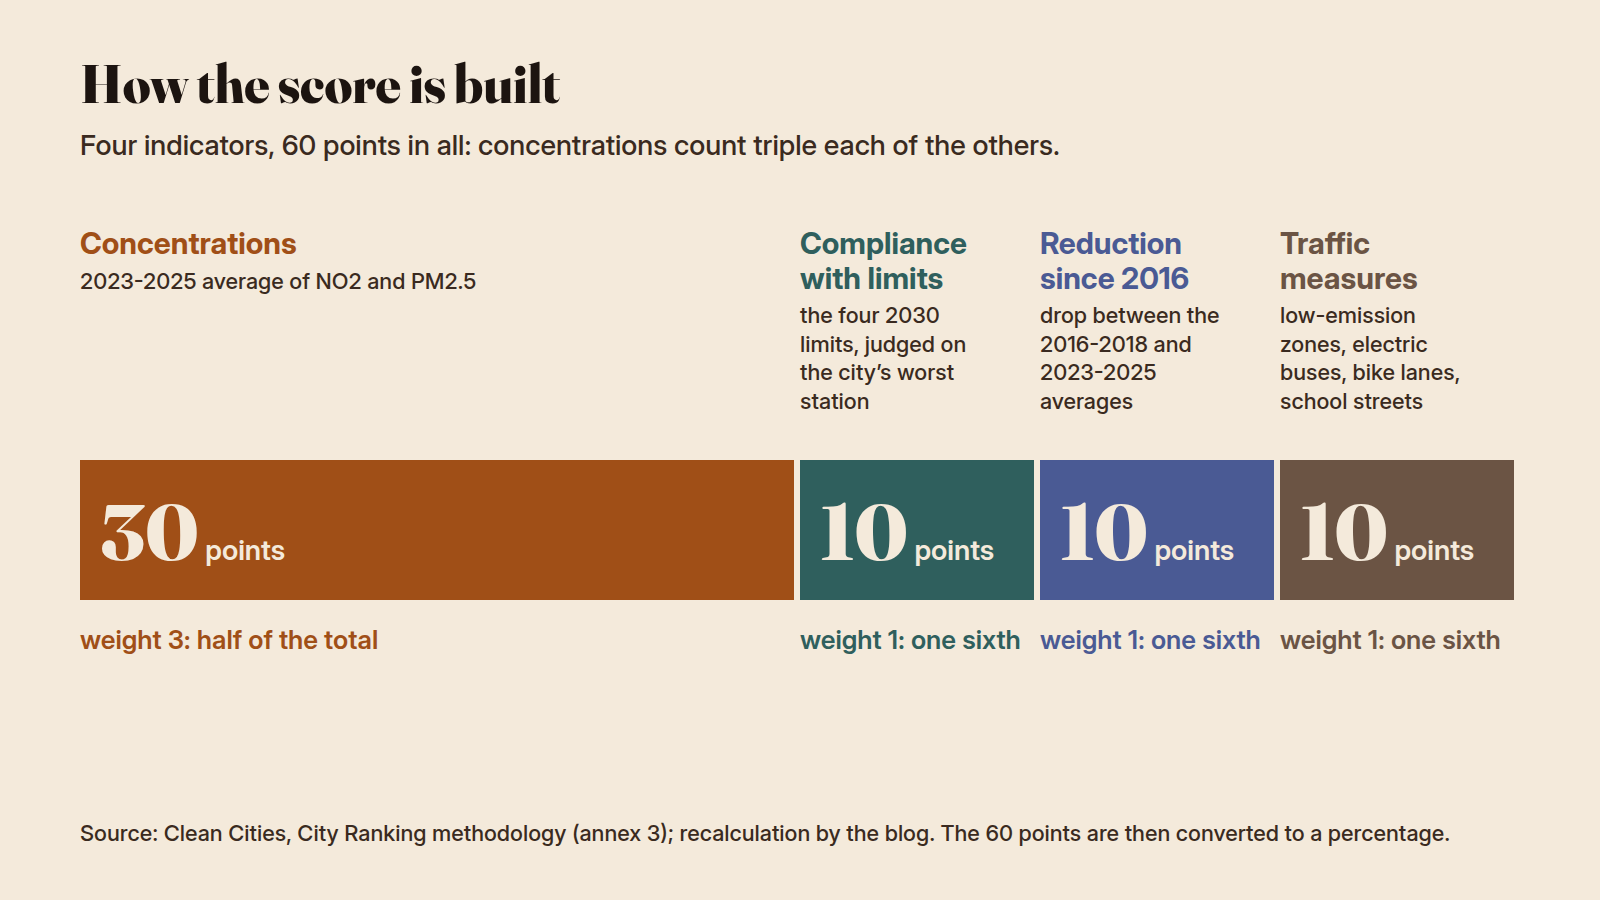
How the score is built: weights 3+1+1+1 on 60 points. Source: Clean Cities, City Ranking 2026.
## What scores do the five Italian cities get, and on what?
The report’s five Italian cities are these:
- Florence, 22nd: 54.2%;
- Bologna, 27th: 48.3%;
- Rome, 32nd: 40.0%;
- Milan, 36th: 35.5%;
- Turin, 37th: 35.0%.
The report’s table shows how those totals come about. On average pollutant concentration, Milan has 8.8 points out of 30 and Turin 8.0: the two cities are 39th and 40th of 40. According to the report, fine particulates are higher in Milan and in Turin than in each of the other 38 cities, 19.5 and 18.7 µg/m³ on average in 2023-2025; from 2030 the annual limit will be 10 µg/m³. The [report](https://cleancitiescampaign.org/city-ranking-2026-free-to-breathe/) explains that fine particulates are less directly linked to the vehicle fleet than nitrogen dioxide, because geography, weather, and home heating also play a major role, and names the Po Valley among the most affected areas in Europe: for the Milan area it writes that, with fine particulates at the level of the World Health Organization guideline, more than 5,000 deaths a year could be avoided. On traffic measures the two cities have 7 points out of 10, tied for fourth place with other cities.
On the reduction in pollution since 2016-18, Turin has the highest score of the five Italian cities (59%); Milan and Bologna have 54%, Rome 53%, Florence 50%. Cities with more measures have generally reduced nitrogen dioxide more: the correlation is 0.50, on a scale where 0 means no link and 1 a perfect link. The report reads it as consistent with the evidence that these measures reduce nitrogen dioxide from road transport, but writes that the association alone does not prove an effect.
The triple weight matters. With equal weights, 1+1+1+1 instead of 3+1+1+1, Milan would rise from 36th to 31st place and Turin from 37th to 30th; counting only the three components on air, without the measures, they would drop to 39th and 38th (with equal weights among the three).
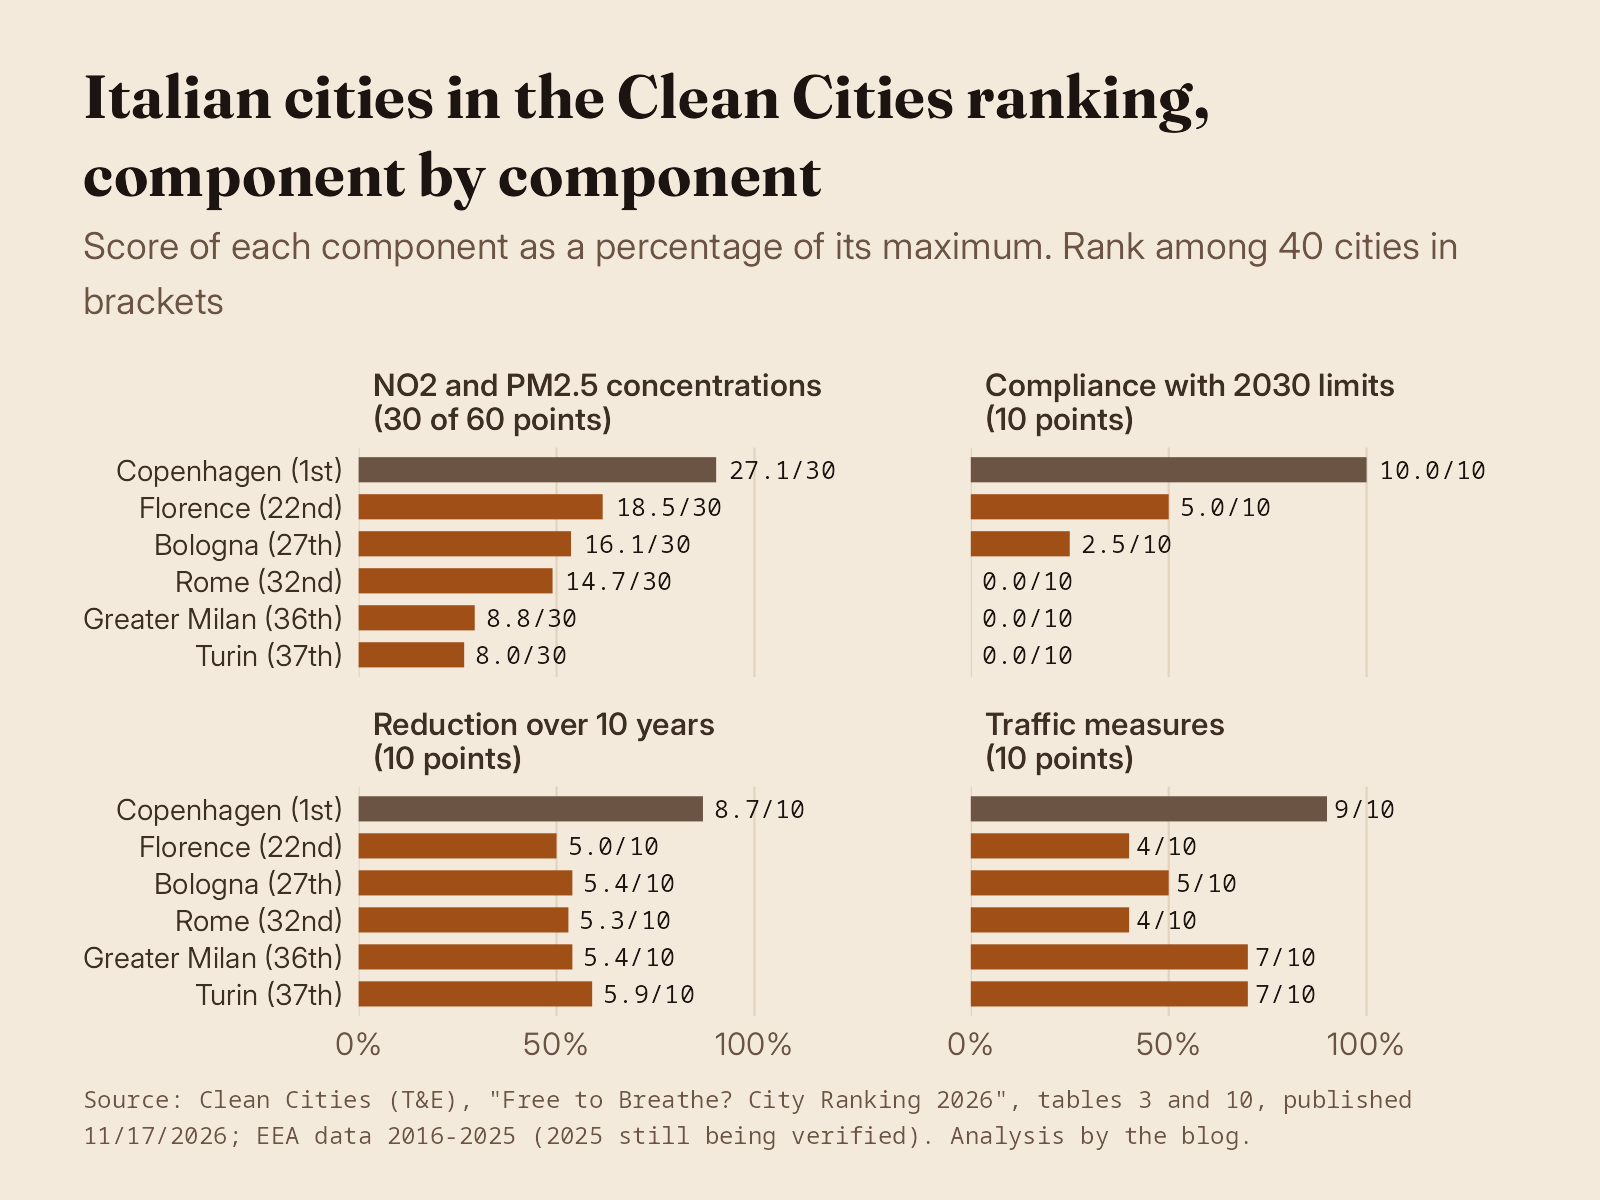
The scores of the Italian cities and of Copenhagen, which is in first place, in Clean Cities’ ranking, by component. Source: Clean Cities, City Ranking 2026.
## Why can a single station fail a whole city?
The second indicator has the strictest criterion. Clean Cities computes it with pass-or-fail tests on the annual and daily limits for NO2 and PM2.5, and a city’s compliance is, according to the report, “determined by the worst-performing monitoring station in the city.” It takes only one station exceeding a limit for that limit to count as failed for the whole city, even if the other stations are below that limit. The report warns that cities with more stations are more likely to exceed a limit, and that its check is not a formal verification: the official process provides exemptions and derogations that the ranking does not consider. Its check does consider the permitted daily exceedances, 18 per year.
The scores for this indicator go up in steps of 2.5 points out of 10, one for each limit met. Florence meets the two daily limits, Bologna only the daily limit for nitrogen dioxide; Rome, Milan, and Turin meet none of them, like 15 other cities. In the whole ranking, 18 cities have zero compliance points.
But zero compliance points do not decide the position alone, because this indicator counts for one sixth. Amsterdam has zero compliance points and is 10th, thanks to a score of 74% on average concentration and 90% on measures; Oslo, with zero points, is 15th and London is 16th.
## Which limits does Clean Cities use: today’s or 2030’s?
Clean Cities uses both kinds of limits, but in two different indicators. The first indicator, which counts for half, starts from today’s annual limits: 40 µg/m³ for nitrogen dioxide and 25 for fine particulates. The second indicator, which counts for one sixth, uses the limits revised by directive (EU) 2024/2881, which apply from January 1, 2030. For fine particulates the limits are 10 µg/m³ as an annual average and 25 daily with at most 18 exceedances; for nitrogen dioxide, 20 annually and 50 daily with at most 18 exceedances.
So “non-compliant,” in the report, means “would not meet the 2030 limits,” measured at the city’s worst station in 2025. “Non-compliant” does not mean “illegal today.” The city-wide averages of the five Italian cities are below today’s annual limits (nitrogen dioxide at most 33.4 out of 40, fine particulates at most 19.5 out of 25) and above those of 2030; whether any station exceeds today’s limits, the ranking does not say.
Sky reports the methodological note of the Clean Cities report: the research “does not constitute a formal verification of legal compliance with the European directive.” According to Clean Cities, 37 of 40 cities would violate the new limits, more than 90% of the total; only Copenhagen, Stockholm, and Helsinki meet them all.
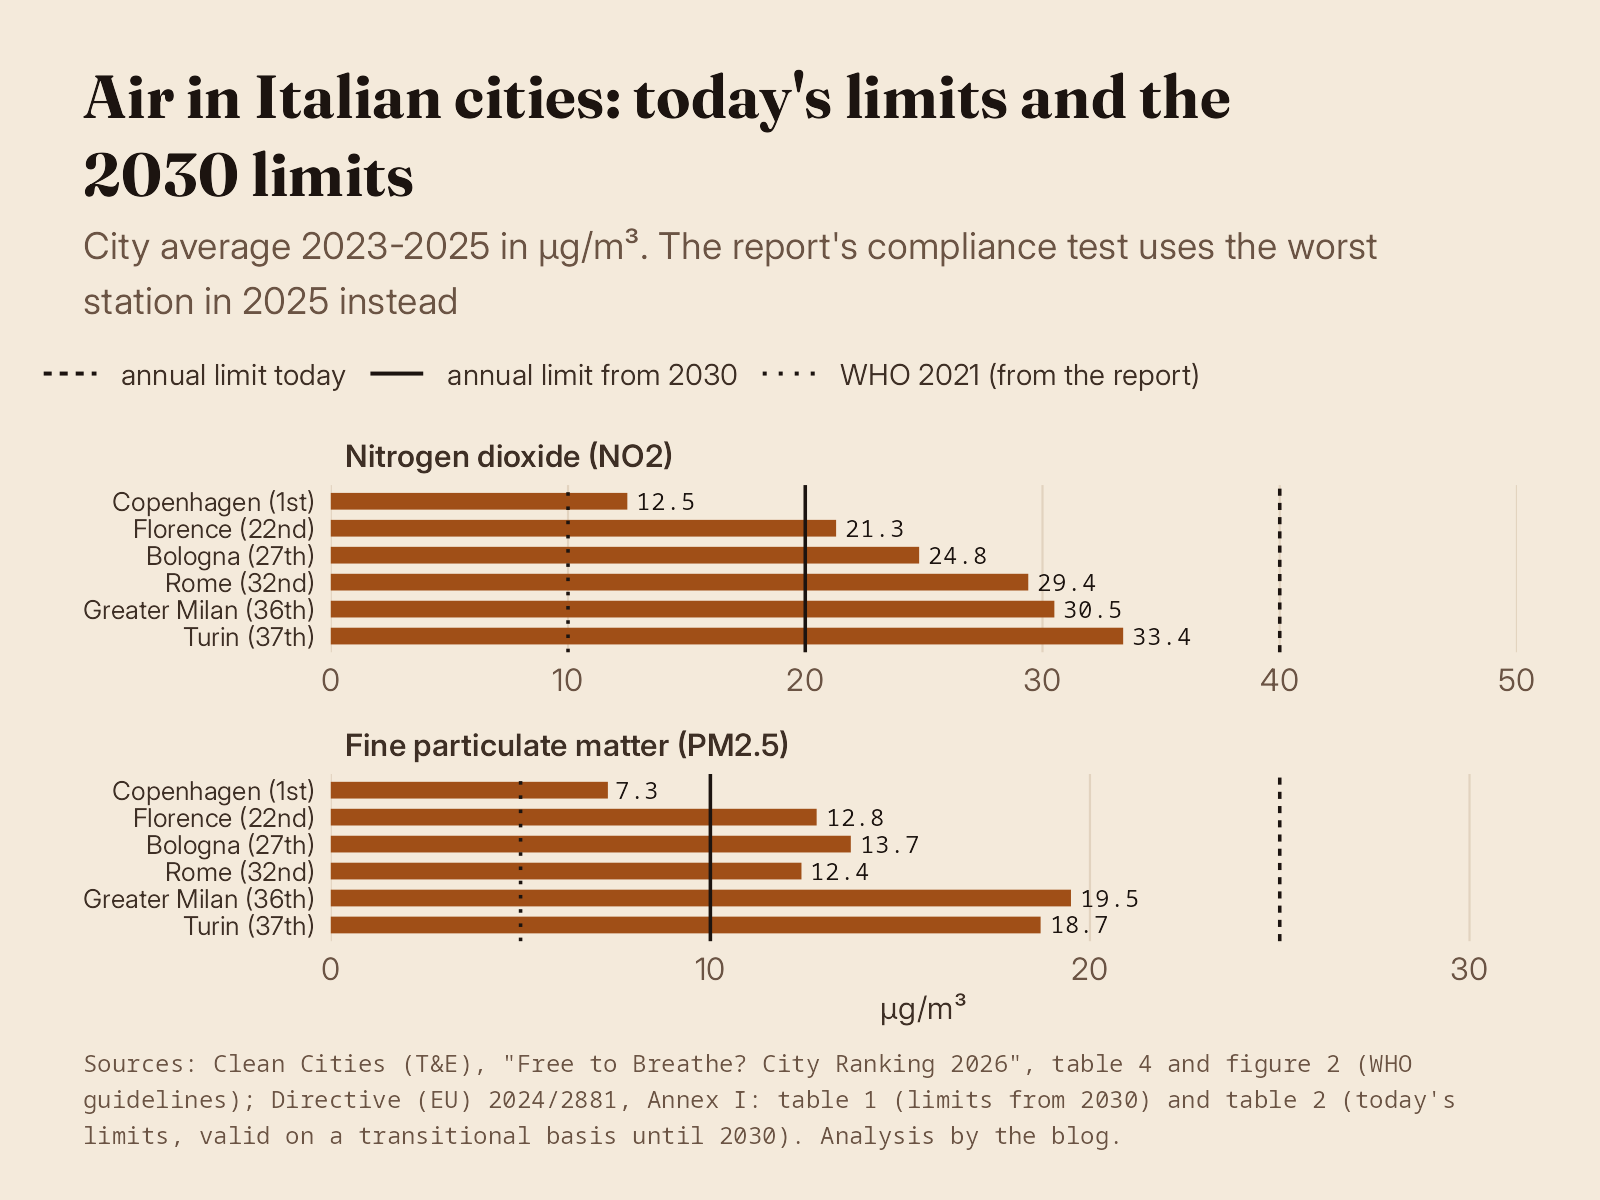
The average concentrations of the Italian cities against European limits for today and for 2030. Sources: Clean Cities, City Ranking 2026; directive (EU) 2024/2881.
## What must Italy do by December 11, 2026?
The directive must be transposed, that is, turned into national law, by December 11, 2026: Article 30 of the text says so and Sky repeats it. According to Article 31, on December 12, 2026 the 2008 directive is repealed, that is, it ceases to apply; today’s limits remain, with the same values, in the new directive until January 1, 2030 (Annex I, Table 2).
## What should readers check when looking at the ranking for their own city?
Four questions help in reading the ranking for your own city. Which area was measured: “Greater Milan” is not the municipality. How much today’s air weighs compared with policies: here half against one sixth. What decides compliance: the worst station, not the average. And with which limits: today’s in the first indicator, 2030’s in the second.
The comparison, the choice of weights, and the fourth indicator belong to an association with a declared goal: the ranking is useful, but it should be read with the report’s table alongside.
The date to watch is December 11: from then on we will see which obligations arrive in the country’s laws.
## Frequently asked questions
Why are Milan and Turin 36th and 37th in Clean Cities’ ranking?
According to Clean Cities, Milan and Turin have the lowest scores among the Italian cities on average NO2 and PM2.5 concentration (29.3% and 26.7%), the indicator that counts for half the total, and like Rome they meet none of the revised limits. On traffic measures the two cities have 70%, the best result among the Italian cities.
Does “non-compliant” mean Milan is breaking the law?
No: “non-compliant” does not mean Milan is breaking the law. Clean Cities’ compliance indicator uses the limits of directive (EU) 2024/2881 that apply from January 1, 2030; the average-concentration indicator starts from the limits in force today. According to the methodological note, reported by Sky TG24, the research does not constitute a formal verification of legal compliance with the European directive.
Which Italian cities are in the ranking and what scores do they have?
According to Clean Cities, Florence is 22nd with 54.2%, Bologna 27th with 48.3%, Rome 32nd with 40.0%, Milan 36th with 35.5%, and Turin 37th with 35.0%. First overall is Copenhagen with 91.3%, last is Athens with 23.0%, out of 40 European cities.
What counts most in Clean Cities’ score?
Average NO2 and PM2.5 concentration in 2023-2025 counts three times as much as each of the other three indicators, that is, half the total, Clean Cities writes. Compliance with limits, reduction since 2016, and traffic measures count for one sixth each, for a maximum of 60 points converted to a percentage.
Who is Clean Cities?
According to Sky TG24, Clean Cities is a European coalition of more than 150 non-governmental organizations. The report, part of the “Free to Breathe” campaign, comes with two petitions addressed to the mayors of Milan and Turin. The data for the first three indicators come from the European Environment Agency. The association compiles the fourth indicator.
When must Italy transpose the air directive?
Italy must transpose directive (EU) 2024/2881 by December 11, 2026, according to Article 30 of the text. Transposing means turning it into national law. The stricter limits apply from January 1, 2030.
## Related reading
- [But Why Do We Italians Pay So Much for Energy?](https://blog.sf-paris.dev/en/why-italy-electricity-costs-more-than-europe/): another comparison between Italy and the rest of Europe, on energy.
- [Italy’s budget and energy: where the MASE’s €14 billion comes from](https://blog.sf-paris.dev/en/italy-energy-14-billion-mase-budget-2027/): where the €14 billion figure announced by the Ministry of the Environment comes from.
## Sources
Pages accessed November 17, 2026. The editorial team read the full report; the European Environment Agency’s figures were not checked against the original database. Quotations from Italian-language sources are translated into English.
1. Clean Cities Campaign, “Free to Breathe? Ranking clean air progress and policy in 40 European cities,” City Ranking 2026: full report (PDF) and page with the table of the 40 cities. Primary (the association that made the ranking).
2. Directive (EU) 2024/2881 of the European Parliament and of the Council of October 23, 2024 on ambient air quality and cleaner air for Europe (recast), Official Journal of the European Union, November 20, 2024: Articles 30 and 31, Annex I. Primary.
3. European Commission, “EU air quality standards” (limits in force today). Primary.
4. Sky TG24, “Qualità dell’aria, Milano e Torino agli ultimi posti in Europa: la classifica” (in Italian; air quality, Milan and Turin near the bottom in Europe: the ranking), November 17, 2026. Secondary; it draws on Clean Cities’ press release.