---
title: "Solar PV in Italy: 2030 Is Close to Today’s Pace"
url: "https://blog.sf-paris.dev/en/italy-solar-pv-2030-target-yearly-pace/"
lang: "en"
translations:
it: "https://blog.sf-paris.dev/fotovoltaico-italia-obiettivo-2030-ritmo/"
author: "Simone Flavio"
published: "2026-11-19T07:00:00+00:00"
updated: "2026-11-13T17:46:39+00:00"
categories:
- "News"
tags:
- "Italy"
- "PNIEC"
- "Renewables"
- "Solar PV"
summary: "On November 11, 2026, Rinnovabili.it wrote that to reach the solar capacity that Italy’s national energy and climate plan (PNIEC) provides for 2030, another 35.5 GW are needed, that is, gigawatts, the unit used to measure the capacity of plants."
reading_time_minutes: 7
word_count: 1570
---
# Solar PV in Italy: 2030 Is Close to Today’s Pace
On November 11, Rinnovabili.it wrote that Italy needs another 35.5 gigawatts of solar PV to meet the target of its national energy and climate plan, the PNIEC. The gigawatt is the unit used to measure the capacity of installations.
The subtraction is easy. A more useful question is whether the pace required is far from today’s. Not very, and the first nine months of this year are doing better than the same period last year. Two unknowns remain: the last quarter, and a part of the target that is not for the power grid.
**In short:** To reach 2030, about 7.1 GW of new solar PV a year is needed, a little more than was installed last year. The plan itself has a similar pace, and the first nine months of 2026 are doing better than the same period last year. A part of the target, however, is for hydrogen and not for the grid.
## The starting point
At the end of 2025, Italy’s installed solar PV capacity is 43,687 MW, that is, 43.7 GW.
So says a report from the solar PV program of the International Energy Agency, which uses data from the GSE, Italy’s energy services operator. That is 18% more than the year before.
The report adds a caution: the capacity actually commissioned in 2025 is 6,520 MW, not the 6,685 that come out of the difference between the two years, because of plants being decommissioned and statistical updates.
To give a sense of scale, in 2025 solar PV produced the equivalent of 15.1% of final electricity consumption.
Per inhabitant it is 741 watts: 114 more than a year earlier.
Storage has grown too, the batteries spread across the territory: 145,942 new in 2025, 884,191 in all.
The smallest plants, under 10 kilowatts, are 85% of the total but about 20% of the capacity.
## The pace required
In its latest version, sent to Brussels in 2024, the PNIEC provides for 79.25 GW of solar in 2030.
That leaves about 35.6 GW: Rinnovabili.it writes 35.5, starting from 79.2 GW.
Over five years that is about 7.1 GW a year. In the last two years almost 6.7 GW a year came online, so the pace required is 6% higher.
Rinnovabili.it notes that more than half of the way is already covered: 43.7 out of 79.25 is in fact 55%.
With the actual capacity of 6.5 GW, the pace required would be 9% higher, not 6%.
Solar PV is the plan’s largest source: out of 131 GW of renewables planned, almost 80 are solar and 28.1 wind.
| Year | Capacity at year-end (MW; 1,000 MW = 1 GW) | New capacity (MW) |
| --- | --- | --- |
| 2020 | 21,650 | 785 |
| 2021 | 22,594 | 944 |
| 2022 | 25,064 | 2,470 |
| 2023 | 30,319 | 5,255 |
| 2024 | 37,002 | 6,683 |
| 2025 | 43,687 | 6,685 |
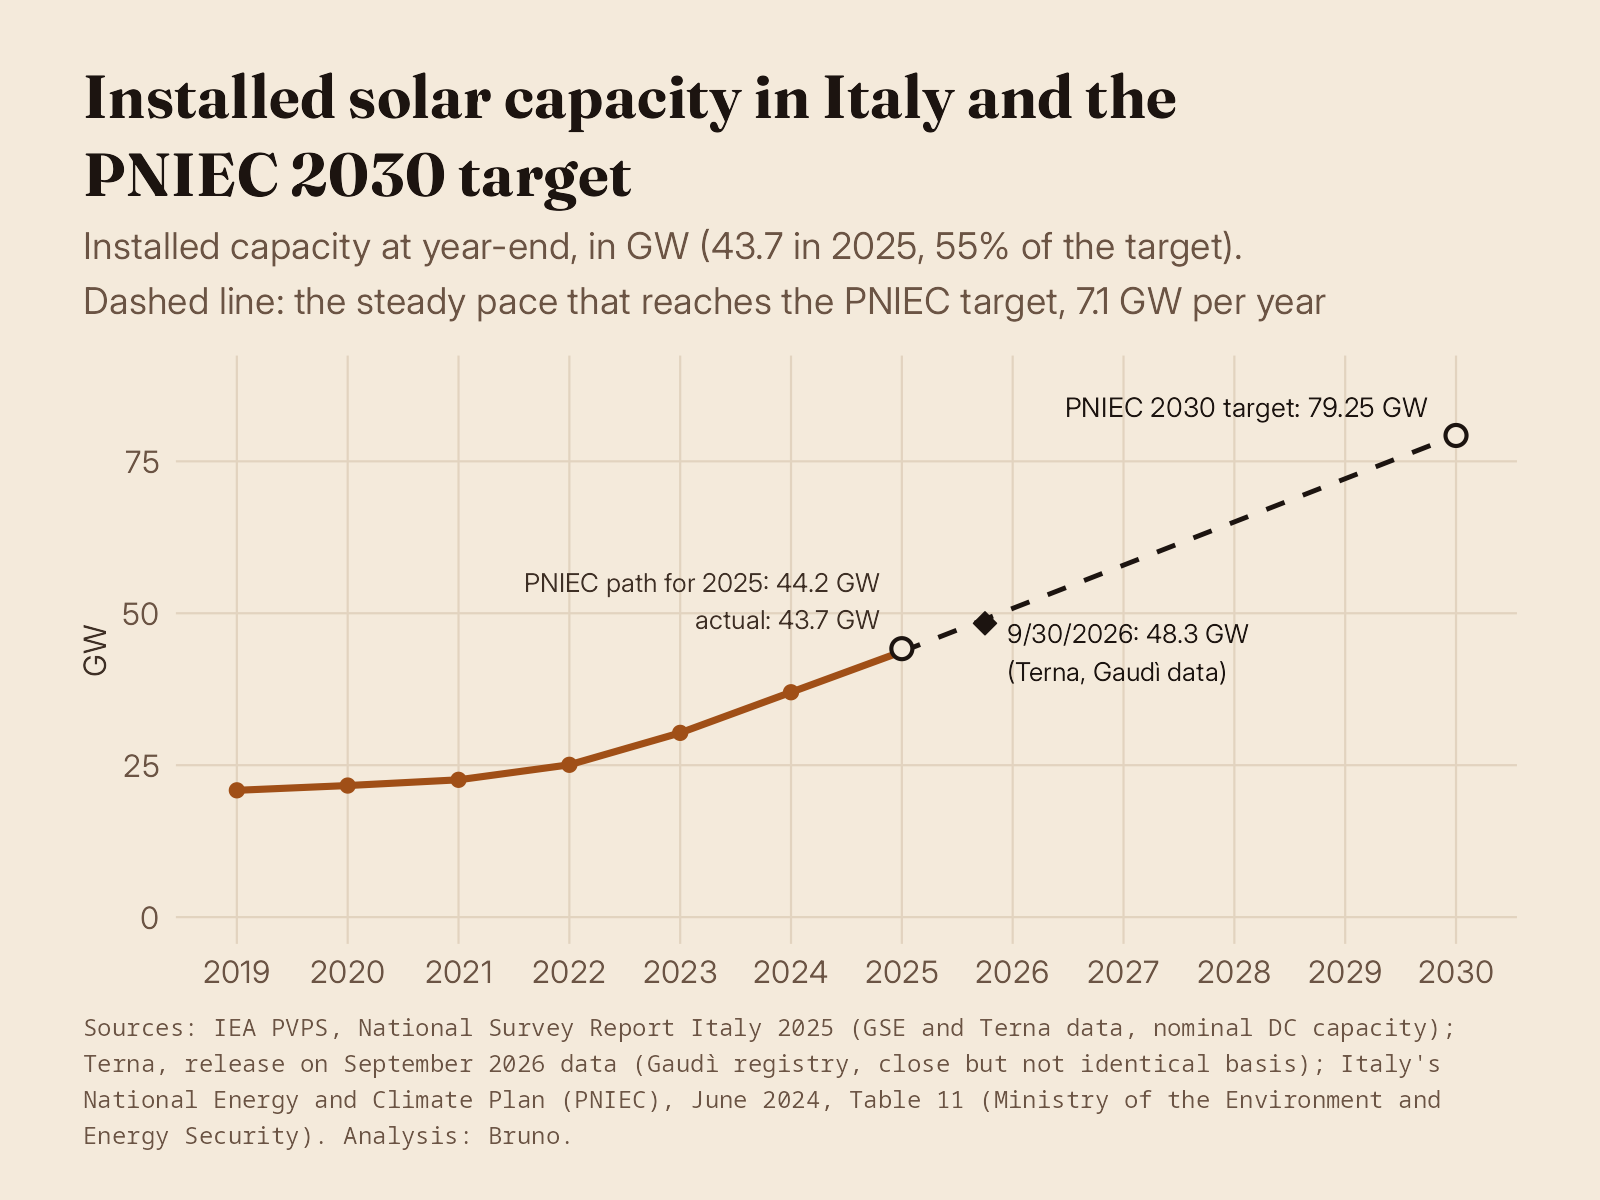
**Chart 1.** Solar PV capacity installed at the end of each year, 2019–2025, Terna’s figure, Terna being the grid operator, at September 30, 2026 (48.3 GW), the plan’s milestone for 2025 and the 2030 target; dashed line: the constant pace that leads to the target.
The intermediate milestone the plan had set for the end of 2025 was 44.2 GW; Italy is 1.1% below it.
Between that milestone and the target the plan has a similar pace: about 7 GW a year. The 7.1 GW is close to what the plan already indicated.
## Data and target: the same unit of measurement?
The GSE’s data measure the panels’ peak capacity. It is the capacity before the inverter, the device that converts it for the grid.
The PNIEC does not say whether its numbers measure the same. It seems so: the plan’s values for past years match the GSE series to the megawatt; those for 2025 and 2030 are model estimates.
The plan’s solar figure also includes capacity whose output will go to electrolyzers, the machines that produce hydrogen. A part of the 79.25 GW therefore does not serve the power grid: the pace required for the grid is probably lower, but the plan does not say by how much.
How much does it weigh? The plan gives an order of magnitude, but in energy, not in capacity. Solar production in 2030 is 97.6 terawatt-hours, the unit of energy produced in a year, and does not include about 10 terawatt-hours to run the electrolyzers: a tenth more. It is an estimate of the energy: the plan does not give the gigawatts.
## The first nine months of 2026
Meanwhile the market has changed. In 2025 the plants commissioned fell by 24%, while new capacity fell by 2%: the report speaks of strong growth that is slowing.
Almost all new plants are under 30 kilowatts, but those above one megawatt make up more than half of the capacity installed in the year.
By sector, the GSE gives industry, the energy sector included, 49% of the capacity and residential 22%.
By region, Lombardy leads with 13% of the capacity.
Ground-mounted plants added 2,499 MW in the year, and now total 14,296 MW, 23% more.
With fewer but larger plants, the pace in gigawatts holds.
According to Terna, the company that runs the power grid, from January to September 4.8 GW of solar PV were installed: the total at September 30 is 48.3 GW.
September alone was 657 MW, 17.5% more than a year earlier. Production is growing too: over the nine months solar PV produced 20.5% more.
For the same period, from the figures of Italia Solare, the industry association, 2026 shows growth of 18.6% over last year.
The 2026 quarters are growing, from 1,439 MW to 1,742.
In 2025 the fourth, with 2,359 MW, was the strongest of the year.
Terna’s and the GSE’s data count in a slightly different way, so the numbers cannot be added together. At the end of 2025 Terna’s basis would give about 43,513 MW, 174 less than the GSE, and the sources do not explain why.
That is why 2026 stands apart. The full year depends on the last quarter, which in 2025 accounted for 37% of the total. Three assumptions, not forecasts:
| Assumption for 2026 | Capacity for the year |
| --- | --- |
| Every month is worth the average of the first nine | 6.4 GW |
| The fourth quarter is worth the same as in 2025 | 7.2 GW |
| The year grows 18.6% over Terna’s 2025 | 7.6 GW |
On Terna’s basis, two assumptions out of three exceed the 7.1 GW required, which is calculated on the GSE’s basis: the comparison is only indicative.
Behind the pace there is a queue of projects. According to ANIE Rinnovabili, which brings together the industry’s companies, 24 GW from renewable sources are still being defined at the Ministry of Culture and the Presidency of the Council, for about €33 billion (MASE data at August 31). It is not said how many are solar.
## Open points
- The full year 2026: the GSE has announced monthly reports on solar PV starting in November, with data by region, capacity class and sector.
- How many of the 79.25 GW are for hydrogen: the plan does not say.
More than the 35 GW still missing, what matters is the pace, about 7 GW a year, a little above that of the last two years. The last quarter will tell whether 2026 reaches that pace.
## Frequently asked questions
How much solar PV does Italy have?
At the end of 2025, installed capacity is 43,687 MW, that is, 43.7 GW, according to a report from the solar PV program of the International Energy Agency, with GSE data. It is data on the panels’ peak capacity.
How much is needed each year to reach 2030?
About 7.1 GW a year from 2026 to 2030, to go from 43.7 to 79.25 GW. In 2025, 6.7 came online.
Is Italy on track with the PNIEC?
Almost: at the end of 2025 it was 486 MW (1.1%) short of the plan’s milestone. For 2026, Terna reports 4.8 GW in the first nine months.
Does the target include solar for hydrogen?
Yes, in part: a note in the PNIEC includes capacity whose output will go to electrolyzers. The plan does not say how many GW that is; in energy, a note to the production table gives about 10 terawatt-hours on top of the 97.6 for solar.
## Read also
- [But Why Do We Italians Pay So Much for Energy?](https://blog.sf-paris.dev/en/why-italy-electricity-costs-more-than-europe/)
- [Italy’s budget and energy: where the MASE’s €14 billion comes from](https://blog.sf-paris.dev/en/italy-energy-14-billion-mase-budget-2027/)
## Methodology note
The figures come from the IEA PVPS report on Italy (November 2026, GSE data: 43,687 MW at the end of 2025, 6,683 and 6,685 MW new in 2024 and 2025), from Tables 11 and 12 of the PNIEC of June 2024 (44,173 MW for 2025, 79,253 for 2030), from Terna (4,834 MW from January to September 2026, 48,347 MW at September 30) and from Italia Solare (report for the third quarter of 2026, figures read from the charts). Differences, averages and percentages are calculations on these figures; the exact distance to the target is 35,566 MW. For the third assumption the base is 2025 on Terna data, 6,436 MW, the sum of Italia Solare’s four quarters.
## Sources
Accessed November 13, 2026. Titles of Italian-language sources are given in the original Italian.
1. IEA PVPS, “National Survey Report of PV Power Applications in Italy 2025,” November 2026. Primary.
2. GSE, “Statistiche, online il Rapporto fotovoltaico 2025,” October 29, 2026. Primary.
3. MASE, PNIEC, June 2024, Tables 11 and 12. Primary.
4. Terna, press release on electricity consumption for September 2026. Primary.
5. Italia Solare, “Report fotovoltaico Q3 2026,” abstract. Secondary.
6. Rinnovabili.it, “Fotovoltaico in Italia, 79,2 GW entro il 2030: ne servono altri 35,5,” November 11, 2026. Secondary.