Insights and guides from an Italian passionate developer

Tag: Eurostat

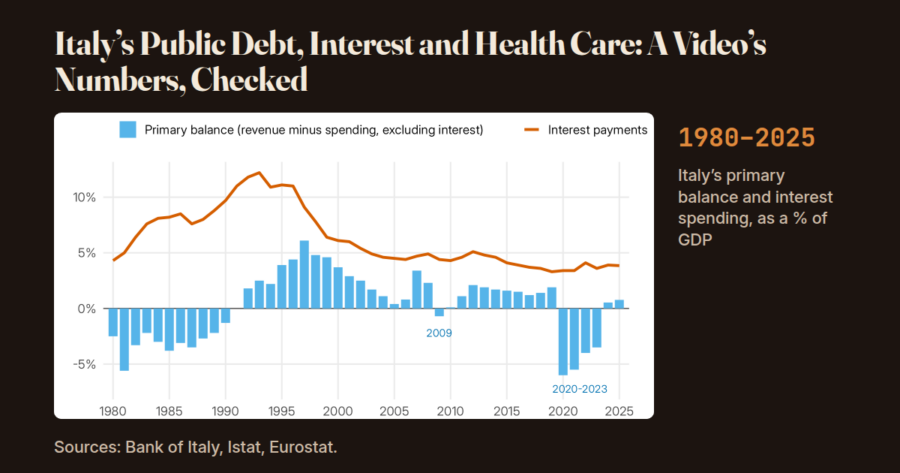
The article title “Italy's Public Debt, Interest and Health Care: A Video's Numbers, Checked” above a chart of Italy's primary balance and interest spending, as a share of GDP, 1980-2025. Sources: Bank of Italy, Istat, Eurostat.

Italy’s Public Debt, Interest and Health Care: A Video’s Numbers, Checked

A video of under three minutes, shared on Instagram, starts from a claim about Italy’s public debt: we were told we lived beyond our means. The guest economist promises to take it apart with numbers.

They are round numbers: billions in debt, interest, hospitals, doctors. But are those figures right?

To find out, I took the claims one by one and compared them with official sources, in eight steps: from the video to the limits of the numbers.

What does the video say?

The video is taken from a piece of a TV broadcast from 2021, “Notizie Oggi Lineasera” on Canale Italia, with the economist Valerio Malvezzi as a guest. It is titled “La grande truffa del debito pubblico” (“The Great Public Debt Scam”). The claims are these, as they read in the video’s subtitles; the video is an edit made by Positano TV:

  • Debt: the public debt accumulated from 1981 to 2020 is “about 2,500 billion” (about €2.5 trillion).
  • Interest: the interest paid over the same period equals the entire debt.
  • Primary surplus: from 2000 to 2020, “except for one year,” the Italian state always took in more than it spent.
  • Households: according to the “sectoral balances” (the accounts of households, businesses, the state and the rest of the world), if the state is in surplus someone else is in deficit, and “for twenty years we have been losing money in households.”
  • Health care: “in the last 10 years,” 170 hospitals closed, and 10,000 doctors, 6,000 nurses and 48,000 health-care employees lost. The video does not say which years it means.
  • Conclusion: the surplus serves to pay the interest, which in the video goes to the banks, at the expense of doctors, nurses and other services; “it is a political choice.”

Two terms are needed right away. The primary balance is the difference between what the state takes in and what it spends, not counting interest on the debt; if it is positive, it is called a surplus. GDP, gross domestic product, is the value of what Italy produces in a year: it is used to compare figures from different eras.

How much did the debt grow, and how much did interest weigh?

The first number holds up, because “about” says enough. According to the historical series of the Observatory on Italian Public Accounts (Osservatorio sui conti pubblici italiani) of the Università Cattolica, an Italian university, based on Bank of Italy data, the debt grew by 2,460 billion euros (€2.46 trillion) from 1981 to 2020. At the end of 2020 the debt was 154.7% of GDP, according to Eurostat, the statistical office of the European Union. “About 2,500” is a fair approximation.

The second is also essentially true. For the period 1981-2020: the interest paid (2,752 billion) was more than the increase in the debt (2,460). The primary balance, by itself, would have reduced it by 586 billion.

Interest (2,752) minus the primary surplus (586) makes 2,166, but the debt rose by 2,460: about 294 billion are missing. That is what Eurostat calls the “stock-flow adjustment”: the part of the increase in the debt that does not come from the year’s deficit, but from accounting operations, for example when the state holds more cash or lends money to others. The Observatory calculates it precisely as the difference between the increase in the debt and the deficit: 292 billion, and 2,166 plus 292 makes 2,458, against 2,460.

The figure should be read with two caveats:

  • Different years: the sum puts together 1981 lire and 2020 euros. Adjusted for inflation the proportion changes, and the high interest costs of the 1980s and 1990s reflected high inflation.
  • Where the debt starts from: in the 1980s the state also ran a primary deficit, −134 billion from 1981 to 1991. The debt rises from 56% of GDP in 1980 to 98% in 1991, and the interest on that debt did the rest.

Today, according to Eurostat, at the end of 2025 the debt is 3,097 billion euros, 136.7% of GDP. Interest costs 87.2 billion euros a year, 3.8% of GDP.

Did the state take in more than it spent?

For almost thirty years, yes, but not “except for one year.” The years without a surplus are two, not one: 2009 and 2020. Between 2000 and 2020 the primary balance is positive in 19 years out of 21. The video does not say which year is the one left out.

Put better: from 1992 to 2019 Italy had a primary surplus every year except 2009. The cumulative surplus over those years is 820 billion, and the interest paid is 2,223. In other words, interest was far larger than the surplus.

Then the picture changes. The primary balance is negative from 2020 to 2023, the years of the pandemic and the energy-price crisis, and turns positive again in 2024 (+11.7 billion) and in 2025 (+17.4 billion, about +0.7% of GDP).
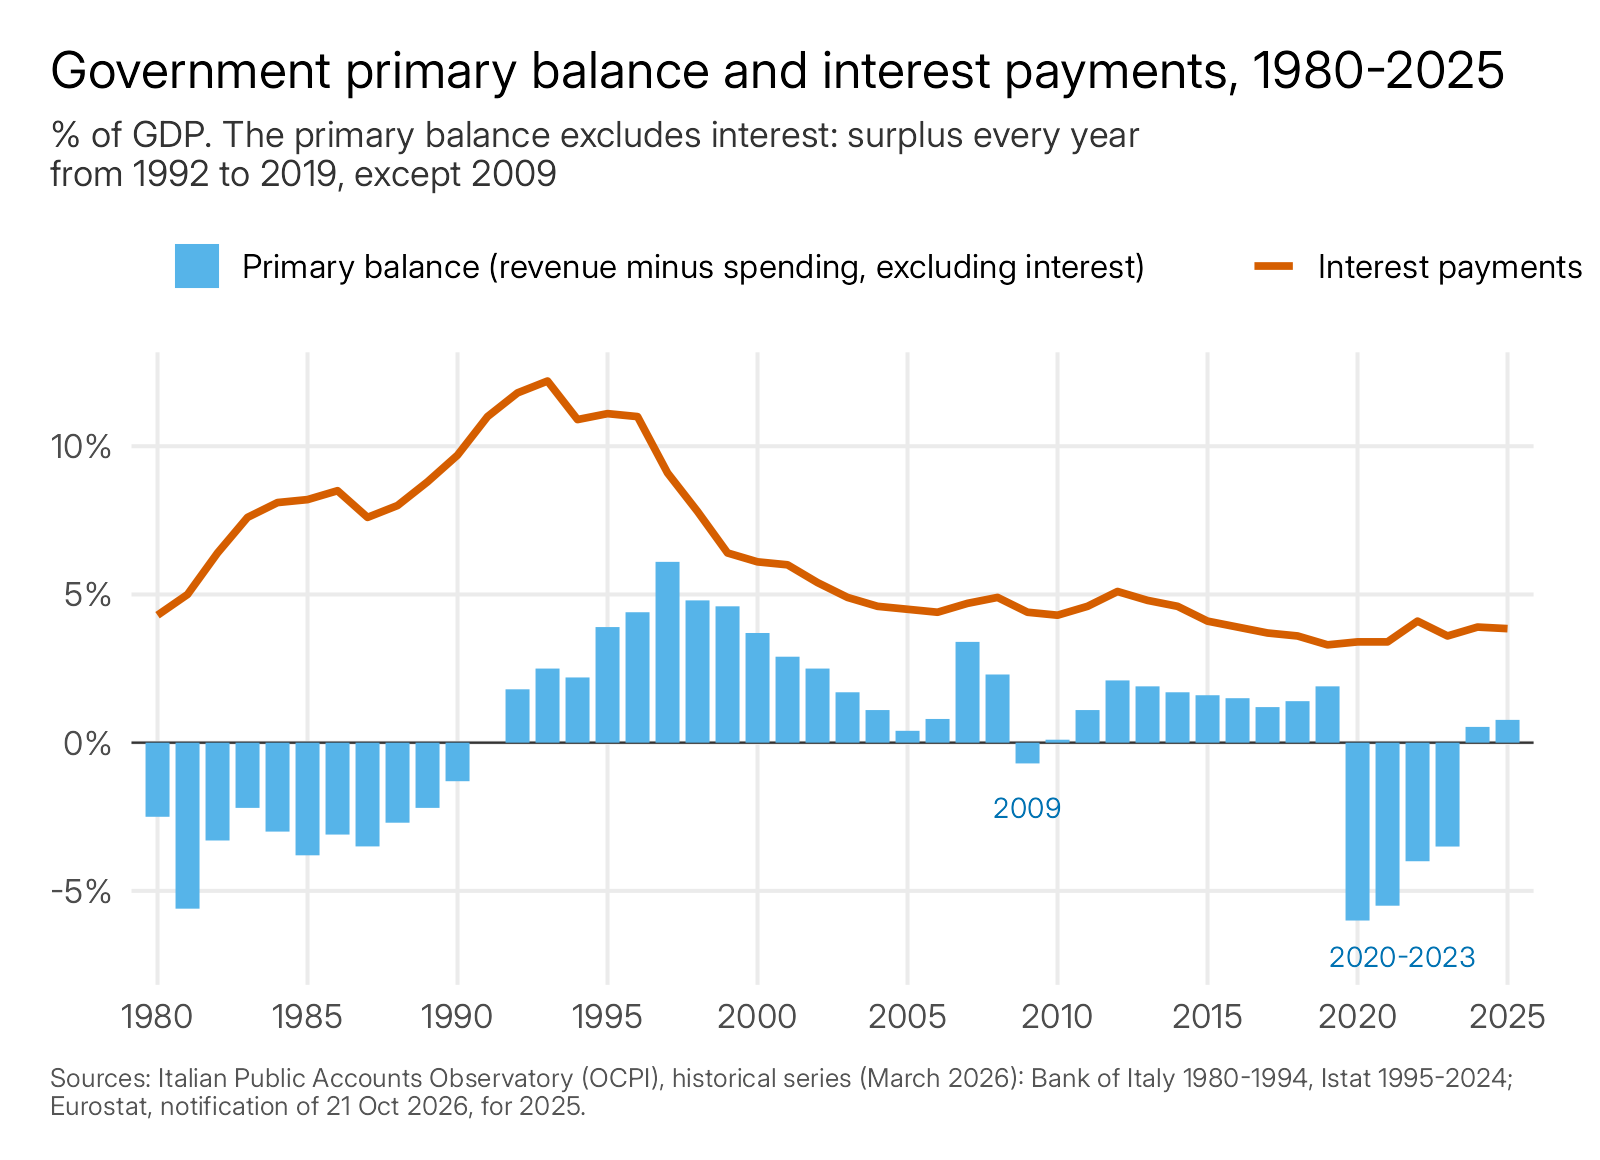
Chart of Italy's primary balance and interest spending, as a share of GDP, from 1980 to 2025: the primary balance is positive every year from 1992 to 2019 except 2009; interest spending rises to 12.2% in 1993 and falls to 3.8% in 2025.
Primary balance and interest spending of the Italian state, as a share of GDP, 1980-2025. The primary balance excludes interest: it is positive every year from 1992 to 2019, except 2009. Source: Observatory on Italian Public Accounts (based on Bank of Italy and Istat data) and Eurostat.

What happened to health care?

The video does not say which years: I took 2010-2019, the last ten with complete data in the yearbooks. No figure matches those in the video exactly:

  • Hospitals: care institutions (hospitals and clinics, public or private under contract) go from 1,165 in 2010 to 992 in 2019, that is, −173; Quotidiano Sanità, a health-care news site, reports them as “closed.” The count is of inpatient facilities, which in the yearbooks also include the aziende ospedaliere (public hospital organizations): it does not count one hospital at a time. Hospital beds fell by 43,471.
  • Doctors: the salaried doctors of Italy’s National Health Service (Servizio sanitario nazionale) go from 107,448 to 102,316, that is, −5,132. With the contracted doctors, meaning family doctors, pediatricians and out-of-hours doctors, the drop is 9,484, about 10,000.
  • Nurses: from 263,803 to 256,429, that is, −7,374.
  • Employees: the salaried staff of Italy’s National Health Service falls by 42,380 (−6.5%); the drop is over 46,000 counting the contracted doctors. The order of magnitude is the video’s; the number is not.

The period matters. With 2020 included, the staffing figures change a lot: nurses go from −7,374 to +883, because of the hiring in the first year of the pandemic, and salaried doctors to −4,356. The video also speaks of “twenty years” of cuts to hospitals: a comparison over twenty years would need the 2000 yearbook.

After 2019 the facilities are stable and nurses come back above the 2019 level (268,013 in 2022).

The video talks about cuts, and cuts are a matter of spending. According to Eurostat, public spending on health care between 2010 and 2019:

  • In euros: from 119.1 to 121.1 billion, almost flat.
  • Adjusted for inflation: 8% lower.
  • As a share of GDP: from 7.4% to 6.7%.

In 2020, with the pandemic, it rises to 130.3 billion, 7.8% of GDP.

How far are the video’s figures from the data?

The gaps go in both directions: the video understates nurses, hospitals and the years without a surplus, and overstates doctors and employees. Here is the comparison, using only the 2010-2019 period for health care:

WhatVideoDataVideo’s gap
Debt 1981-2020about 2,500 billionincrease 2,460; at the end of 2020, 2,578+2% on the increase; −3% on the debt at the end of 2020
Years without a primary surplus, 2000-202012 (2009 and 2020)−1 year
Hospitals (care institutions)170 fewer173 fewer−2%
Doctors10,000 fewer9,484 fewer (with contracted doctors); 5,132 (salaried only)+5% (+95% on salaried only)
Nurses6,000 fewer7,374 fewer−19%
Health-care employees48,000 fewer42,380 fewer (46,732 with contracted doctors)+13% (+3% with contracted doctors)

The gaps are the difference between the video’s figure and the data, divided by the data, and are rounded.

What are sectoral balances, and what do they say about households?

The economy can be divided into four parts: households, businesses, the state (“general government” in the charts) and the rest of the world. Each one’s financial balance is the difference between what it takes in and what it spends. Added together, the four balances come to zero every year. It is an accounting identity, that is, an equation that always balances, by the way it is built; according to AMECO data, the European Commission’s economic database, it holds from 1995 to 2025 with no discrepancies.

The video, on this point, is right: if one part is in surplus, another is in deficit.

But what enters the identity is the total balance of the state, interest included, not the primary balance. The primary balance says the state took in more than it spent; the total balance is negative every year: overall, the state spent more than it took in. They are two different measures.

Balance, % of GDP2000201920202025
State (general government), interest included−2.4−1.5−9.4−3.1
Households, with nonprofit institutions+3.7+2.0+7.9+1.9

So if the state overall spends more than it takes in, someone else must be in surplus, and households are, every year: their financial balance, which is what the identity measures, is positive every year from 1995 to 2025. It was +10.3% of GDP in 1995. Other things, such as incomes or purchasing power, the financial balance does not measure.
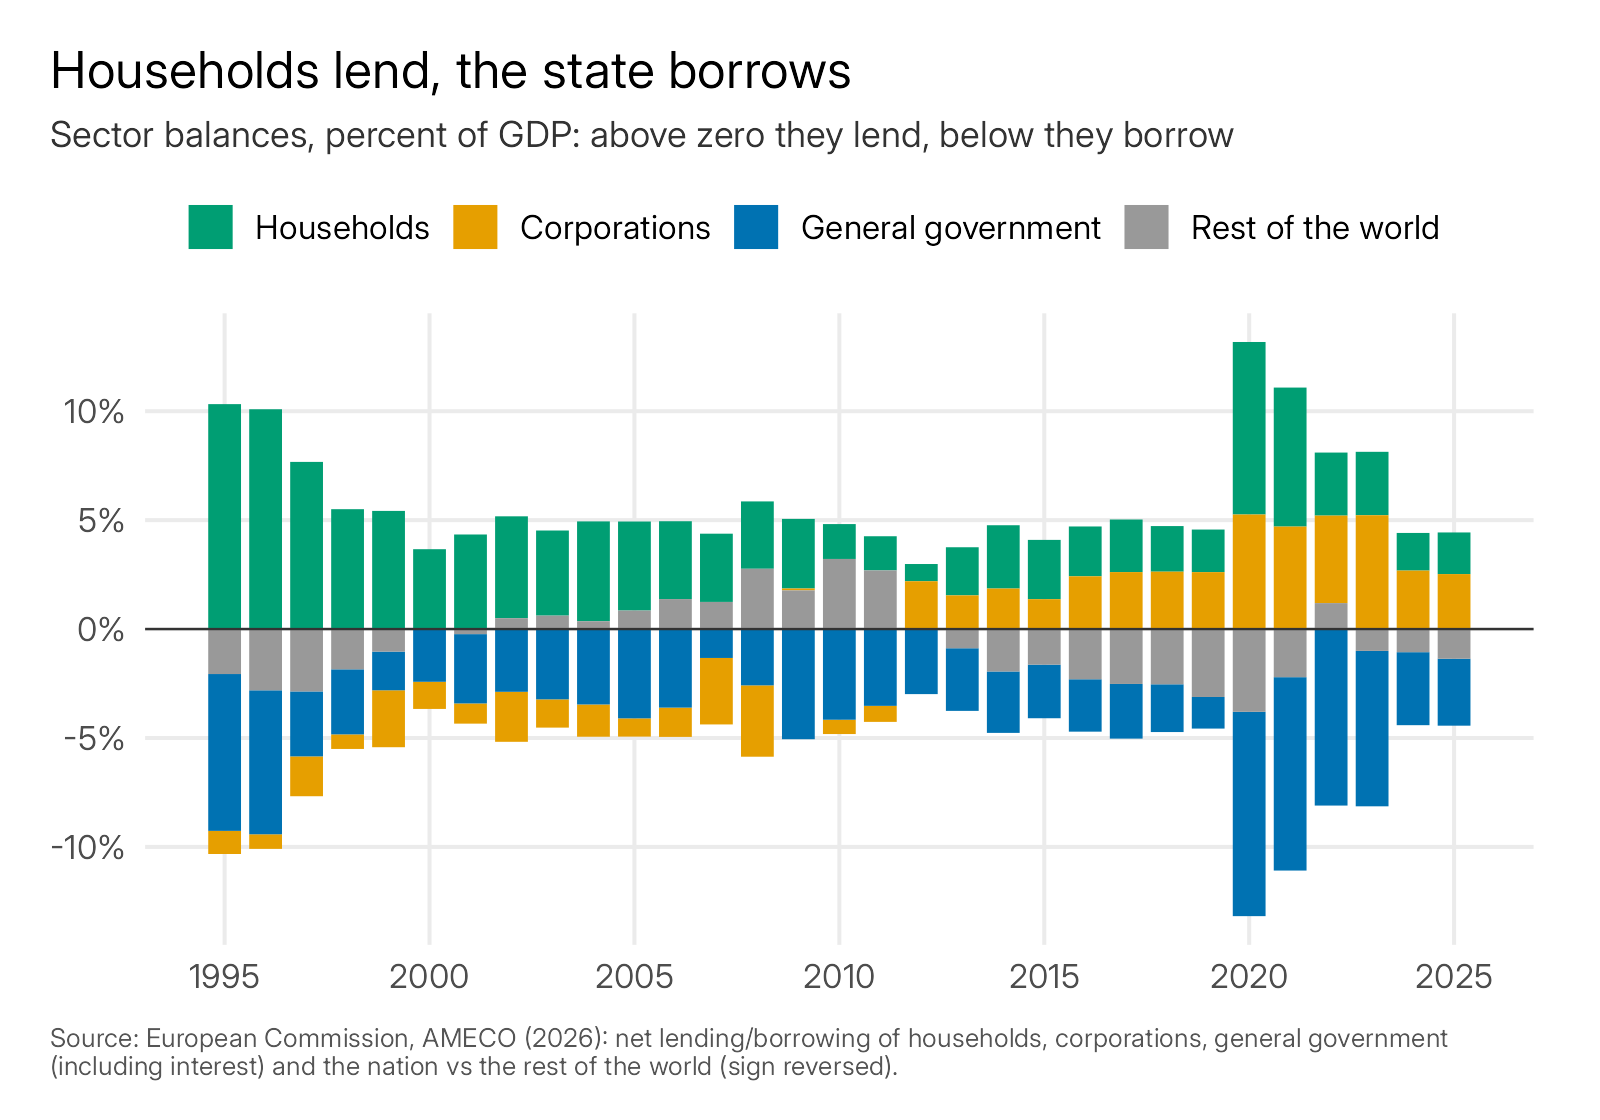
Bars showing the financial balances of households, businesses, general government and the rest of the world in Italy, as a share of GDP, from 1995 to 2025: households are above zero every year, general government below zero.
Financial balances of households, businesses, general government and the rest of the world, as a share of GDP, 1995-2025. Source: European Commission, AMECO (2025 data provisional).

Do the numbers show that the surplus was used to pay interest at the expense of health care?

The data show four true things in the same years:

  • Primary surplus: from 1992 to 2019, almost every year.
  • Interest: higher than the surplus, so the debt rises.
  • Facilities and staff: in 2010-2019, fewer facilities, fewer hospital beds and fewer staff in health care.
  • Health spending: almost flat in euros, down adjusted for inflation and as a share of GDP.

That the reduction in facilities and staff was decided in order to pay the interest, however, is a political claim. The numbers do not prove it, and do not rule it out: they say that things happened in the same years, not that one caused the other.

Lower spending is compatible with the video’s claim, but also with other explanations: regional deficit-reduction plans (the plans under which regions with deficits in their health-care accounts must put them back in order), the European rules on the deficit, or the reorganization of the hospital network. They remain associations, not proof. In the video it is the guest economist’s claim.

What can’t the numbers say?

Three limits, each tied to the data. Debt, interest and balances are in nominal euros, not adjusted for inflation, so adding up different decades is an approximation: the charts use the percentage of GDP. For health care, the 2010 and 2019 figures come from a secondary source, a news site that compares the yearbooks, and the counts of institutions are of inpatient facilities, not of hospitals one by one. The 2025 data are not yet final.

The rest is not a question of numbers. The video also says that it is the banks that collect the interest: the data in this check do not say who holds the debt. And whether the reduction in facilities and staff was a right or wrong choice, and whether it could have been avoided, is a political judgment: the numbers inform it but do not settle it.

All that remains is to see, in the years ahead, whether the primary surplus of 2024 and 2025 becomes a habit again.

Frequently asked questions

Has Italy’s public debt really grown by about 2,500 billion euros between 1981 and 2020?

Essentially, yes. According to the Observatory on Italian Public Accounts, based on Bank of Italy data, the increase is 2,460 billion euros, from 116.7 to 2,576.6; according to Eurostat the debt at the end of 2020 was 2,578 billion, 154.7% of GDP. At the end of 2025 it is 3,097 billion, 136.7%.

Is the interest paid equal to the entire debt?

Yes, and in fact it was more. From 1981 to 2020 the interest paid was 2,752 billion, against an increase in the debt of 2,460. The sum, however, puts together 1981 lire and 2020 euros: adjusted for inflation the proportion is different.

Did Italy have a primary surplus every year from 2000 to 2020, except one?

No, the negative years are two, 2009 and 2020. The primary surplus is there every year from 1992 to 2019, except 2009. After four negative years, from 2020 to 2023, it turns positive in 2024 and 2025. The video does not say which year is the one left out.

How many hospitals, doctors and nurses were lost in ten years, and how much did spending fall?

The video’s figures are close but not equal, and the video does not say which years it means. Between 2010 and 2019, according to the yearbooks of the Ministry of Health, care institutions fall by 173, salaried doctors by 5,132, nurses by 7,374 and salaried staff by 42,380. Public spending on health care goes from 119.1 to 121.1 billion, 8% lower adjusted for inflation.

Have Italian households been losing money for twenty years?

The households’ financial balance is positive every year from 1995 to 2025. According to AMECO data, they set aside more than they borrow. The state, interest included, has always been in deficit. The financial balance counts only what is lent and what is borrowed: it does not measure income or purchasing power.

More number checks

Other articles on this blog that check numbers against official sources:

Download the data and the code

I put the data and the code with which I redid the calculations into a zip file, so that anyone who wants to can repeat the analyses. Inside are the data from Eurostat (debt, deficit and interest since 1995; public health spending), from AMECO (sectoral balances) and from the health-care yearbooks, in CSV files, that is, plain-text tables; the scripts that download the sources, redo the calculations and draw the two charts, written in R, a language for data analysis; and a file of instructions. The historical series of the Observatory on Italian Public Accounts, which covers the decades 1980-2025, is not in the file: the script downloads it from the Observatory’s website. Download the data and code for the analysis (zip): 16 KB (16,050 bytes), file dated November 2, 2026, SHA-256 b4817facb34417c9af22b250338a1ed936236cb2519c557baf2471c43b1db20d. The data come from the sources listed below.

Method note (for those who want to check the math)

Debt, interest and the primary balance come from the Serie storiche di finanza pubblica (historical series of public finance) of the Observatory on Italian Public Accounts (Università Cattolica), March 2026 file: the data are from the Bank of Italy for 1980-1994 and from Istat, Italy’s national statistics office, from 1995. At the end of 1980 the debt was 116.7 billion euros and at the end of 2020 2,576.6 (Observatory); Eurostat gives 2,578 billion at the end of 2020. Eurostat (table gov_10dd_edpt1, notification of October 21, 2026) gives 2020 and 2025 and a check: for 2019, 2020 and 2024 the difference with the Observatory is under 2 billion. AMECO, the European Commission’s database, gives the sectoral balances. Health spending is the “Health” item of the classification of the functions of government (COFOG 07) of Eurostat; adjusted for inflation means at 2010 prices, with the GDP deflator.

The cumulative primary balance 1981-2020 is +586 billion; the cumulative interest 1981-2020 is 2,752 billion; the stock-flow adjustment is +292.4 billion (item L of the Observatory). According to Eurostat it includes the cash held by the Treasury, loans, equity holdings (net of privatizations), exchange rates and statistical discrepancies; the Observatory calculates it as the difference between the increase in the debt and the deficit (item L = change in debt plus net borrowing): it does not measure the individual items. The calculation, 2,752 minus 586 plus 292, makes about 2,458 against an increase of 2,460, and the remainder, 1.4 billion, is due to the rounding of the series as a percentage of GDP. For 1981-2025 interest is 3,147 billion, against an increase in the debt of 2,980.

For health care, the 2010 and 2019 figures come from the comparison of the statistical yearbooks of the Ministry of Health (the annual collections of data) published by Quotidiano Sanità; those for 2020 and 2022 from the yearbooks themselves. For nurses, in the yearbooks (2010, 2019, 2020 and 2022) the drop between 2010 and 2019 is 7,374, and with 2020 it disappears. After 2019: inpatient facilities stable between 2016 and 2022; salaried doctors 101,827 and employees 625,282 in 2022. The Conto annuale (annual accounts) of the State General Accounting Office, which shows the data only through an interactive application, is left out of this comparison.

The video’s quotations are read from the subtitles burned into the edit, one frame per second: the audio was not transcribed. Quotations from Italian-language sources are my translations.

Sources

Accessed November 2, 2026. I mark the type of each source: primary (whoever produces the data), derived (calculated from primary data), secondary. Titles of Italian sources are in the original, with an English translation in brackets.

  1. Osservatorio sui conti pubblici italiani (Università Cattolica), Serie storiche di finanza pubblica [“Historical series of public finance”], March 2026 file (debt, interest, primary balance, stock-flow adjustment; Bank of Italy and Istat data). Primary; derived from primary data. https://osservatoriocpi.unicatt.it/content/dam/siti-web/ricerca/osservatorio_cpi/risorse/ocpi-OCPI%20-%20Serie%20Storiche%20marzo%202026.xlsx (page: https://osservatoriocpi.unicatt.it/risorse/serie-storiche.html)
  2. Eurostat, government debt, deficit and interest (gov_10dd_edpt1), notification of October 21, 2026 (2020, 2025 and check). Primary. https://ec.europa.eu/eurostat/databrowser/view/gov_10dd_edpt1/default/table
  3. European Commission, AMECO, sectoral balances (households, businesses, general government, rest of the world), 2026 (2025 data provisional). Primary. https://ec.europa.eu/economy_finance/db_indicators/ameco/documents/ameco16.zip (page: https://economy-finance.ec.europa.eu/economic-research-and-databases/economic-databases/ameco-database_en)
  4. Ministero della Salute, Annuario statistico del Servizio sanitario nazionale [“Statistical yearbook of the National Health Service”], 2020 and 2022 editions. Primary. https://www.quotidianosanita.it/allegati/allegato1658825757.pdf (2020) and https://www.quotidianosanita.it/allegati/allegato1712573646.pdf (2022)
  5. Quotidiano Sanità, comparison of the 2010 and 2019 yearbooks (care institutions, doctors, nurses, staff). Secondary. https://www.quotidianosanita.it/studi-e-analisi/in-anni-chiusi-ospedali-personale-ridotto-di-mila-unit-scarsi-progressi-sull-assistenza-territoriale-e-sempre-pi-spazio-al-privato-ecco-com-arrivato-il-ssn-di-fronte-al-covid/
  6. Eurostat, general government expenditure by function (gov_10a_exp, COFOG 07 “Health”), updated October 21, 2026. Primary. https://ec.europa.eu/eurostat/databrowser/view/gov_10a_exp/default/table
  7. Eurostat, Stock-flow adjustment note, October 2018. Primary. https://ec.europa.eu/eurostat/documents/4187653/9329991/STOCK-FLOW-2018-OCT.pdf/618b019d-c80a-43dc-a4d6-a58103d402ca
  8. Positano TV, reel “La grande truffa del debito pubblico” (“The Great Public Debt Scam”), an edit of a piece of “Notizie Oggi Lineasera,” Canale Italia, 2021, with the economist Valerio Malvezzi. Subject of the check. https://www.instagram.com/reel/DfO5H2mteBg/
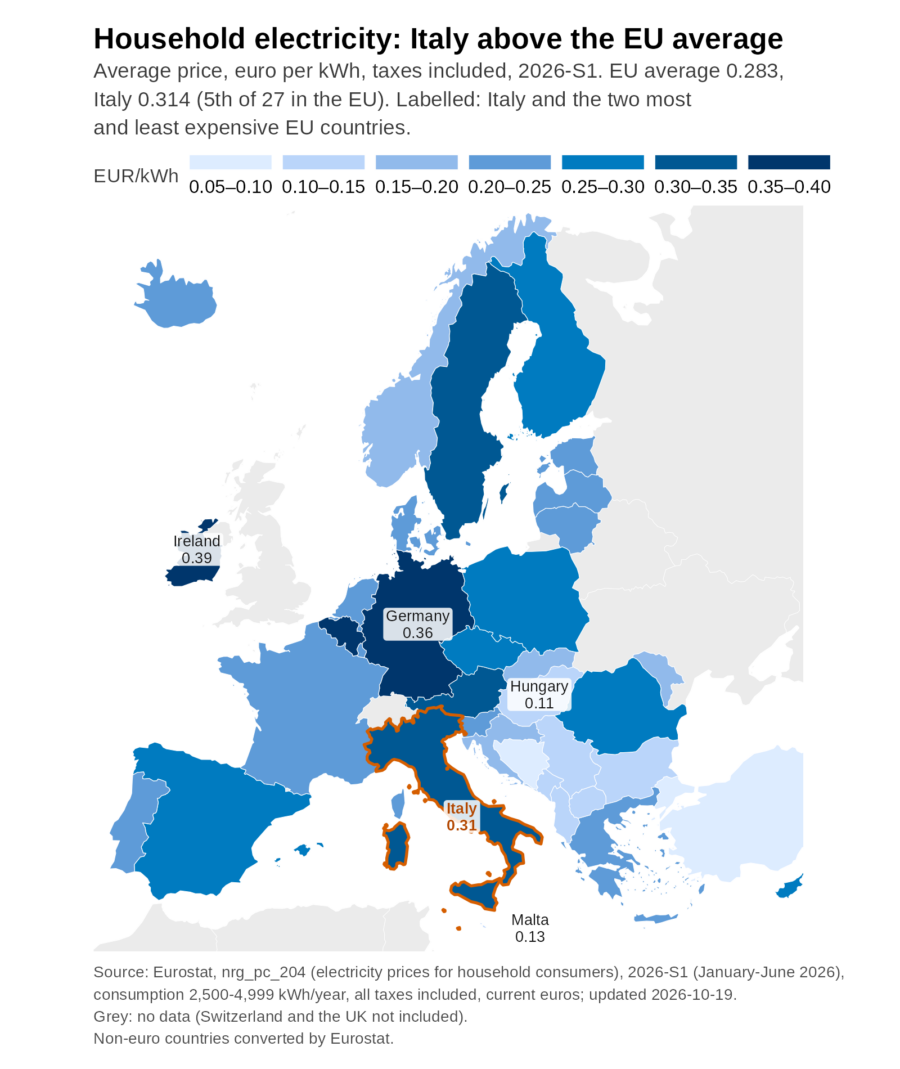
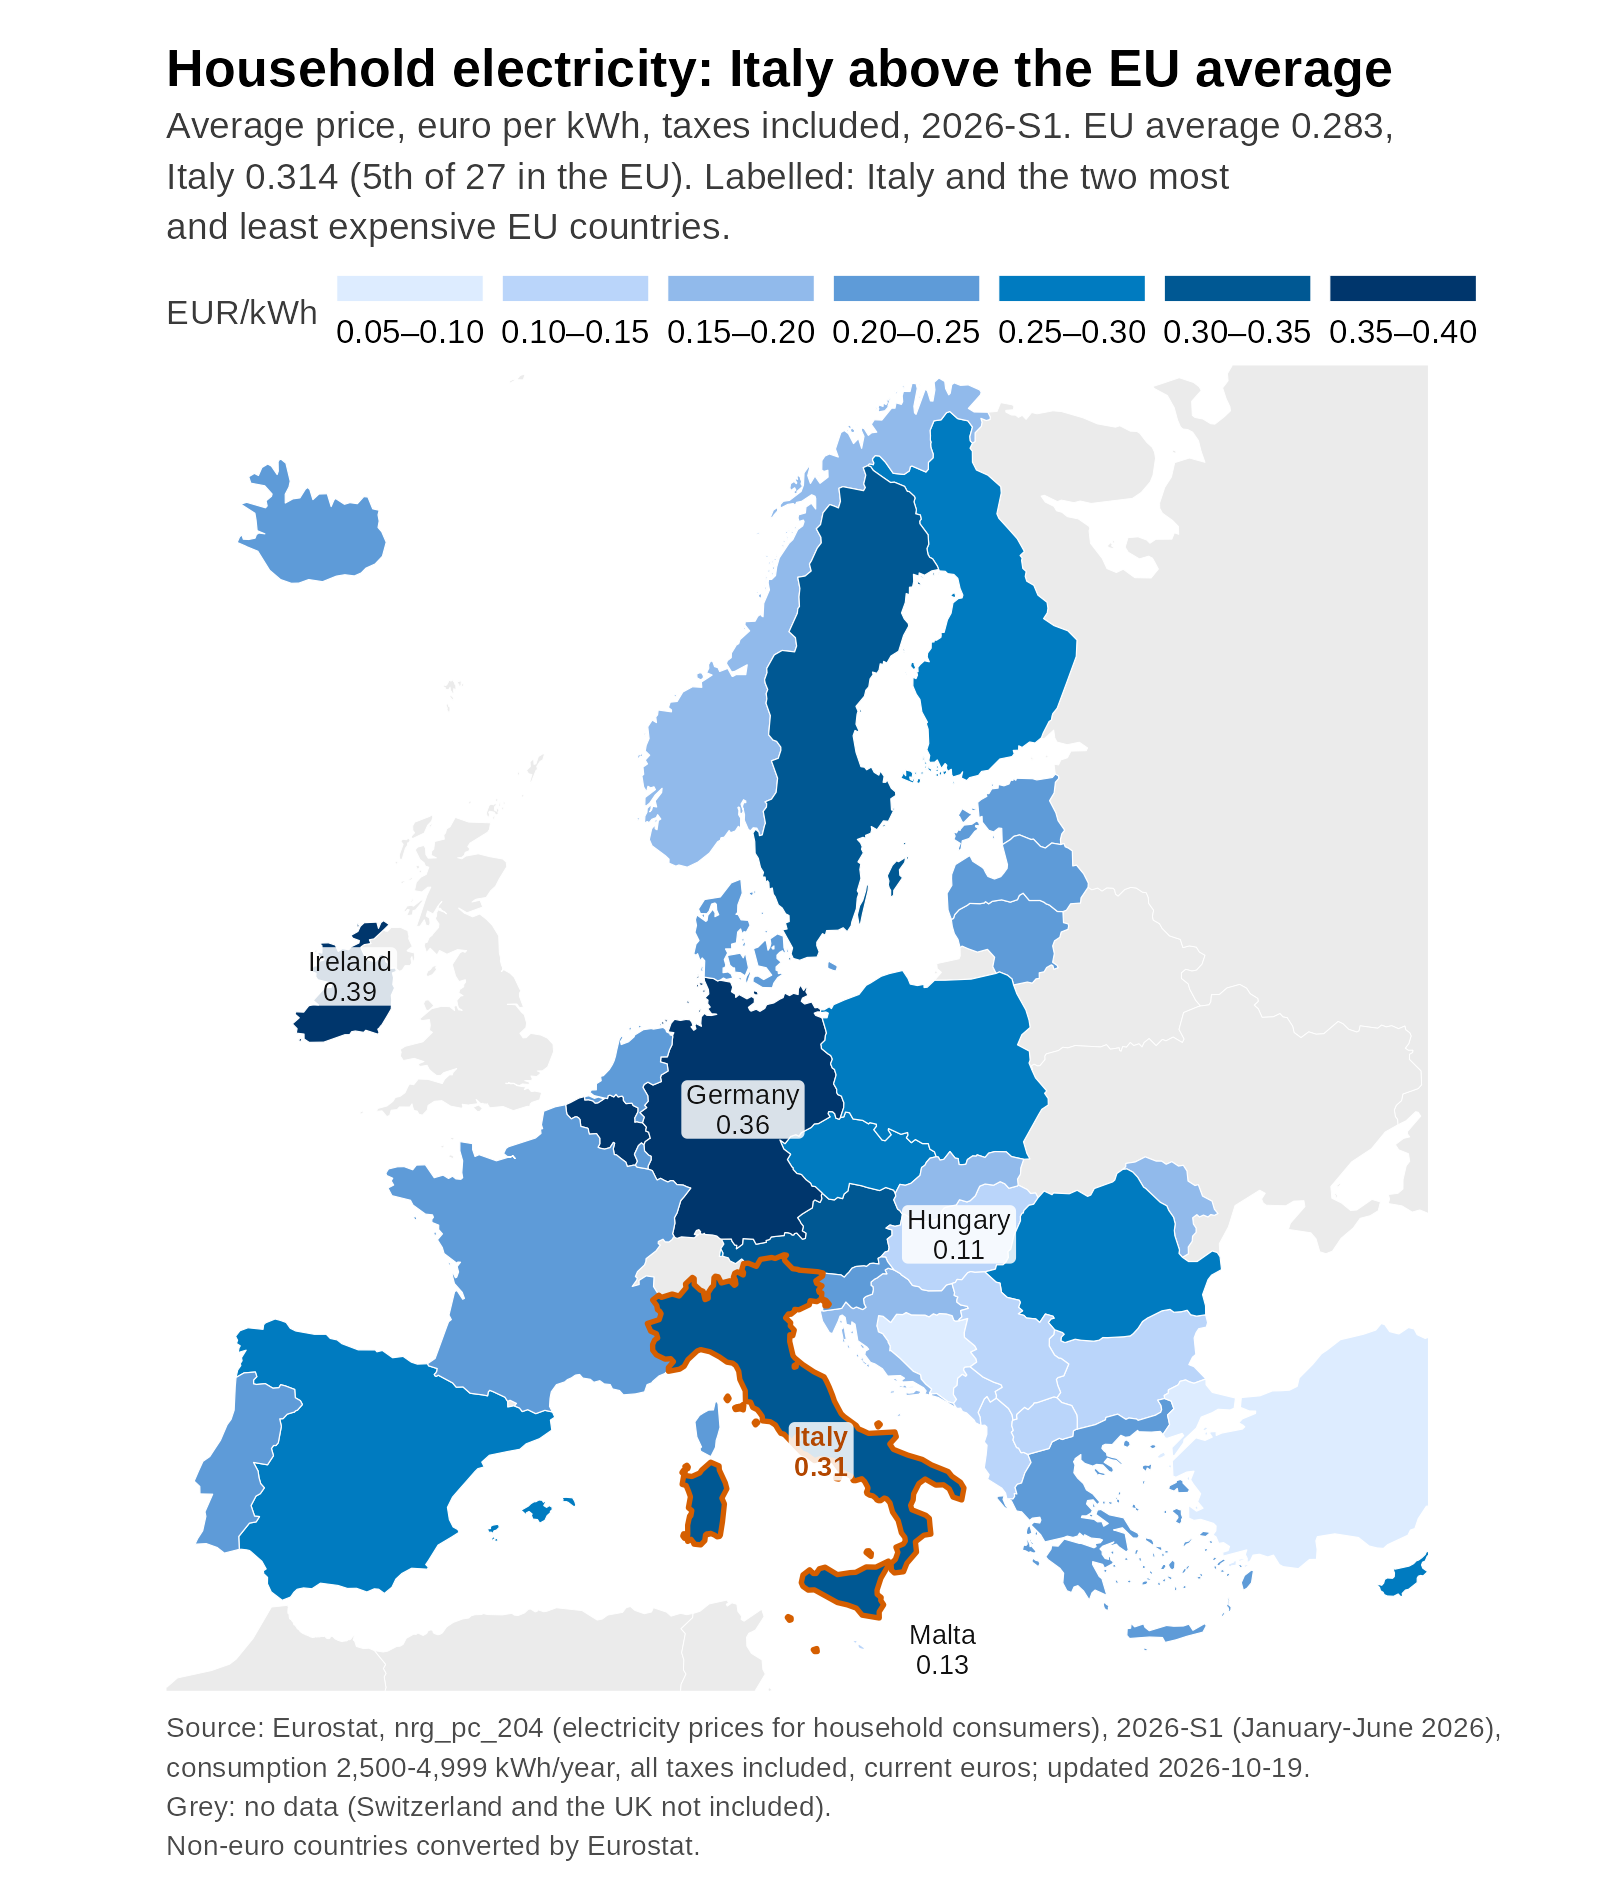
Map of Europe colored by household electricity price in the first half of 2026, in euros per kWh: Italy highlighted at 0.31, Germany 0.36 and Ireland 0.39 among the most expensive countries, Hungary 0.11 and Malta 0.13 among the cheapest.

But Why Do We Italians Pay So Much for Energy?

In the first half of 2026, an Italian household paid an average of 0.314 euros for every kilowatt-hour (kWh, the unit used to measure electricity), taxes included, for consumption between 2,500 and 4,999 kWh a year. That is 11% more than the European Union average, 0.283, according to Eurostat, the statistical office of the Union.

Only Ireland, Germany, Belgium and Austria paid more. Compared with France (0.249 euros per kWh) and Spain (0.251), we pay about a quarter more; compared with Germany, which pays 0.362, we do not. Where does the difference come from?

Map of Europe colored by household electricity price in the first half of 2026, in euros per kWh: Italy highlighted at 0.31, Germany 0.36 and Ireland 0.39 among the most expensive countries, Hungary 0.11 and Malta 0.13 among the cheapest.
Average electricity price for households in Europe, first half of 2026, euros per kWh, taxes included (households with consumption of 2,500-4,999 kWh a year). Source: Eurostat.

For businesses the distance is greater: 0.225 euros per kWh without VAT, 25% above the European average. Only Ireland and Cyprus do worse than we do, according to Eurostat.

To answer, I looked at three things: taxes, the wholesale price, and what changes in the countries that pay less.

Taxes Do Not Explain the Gap

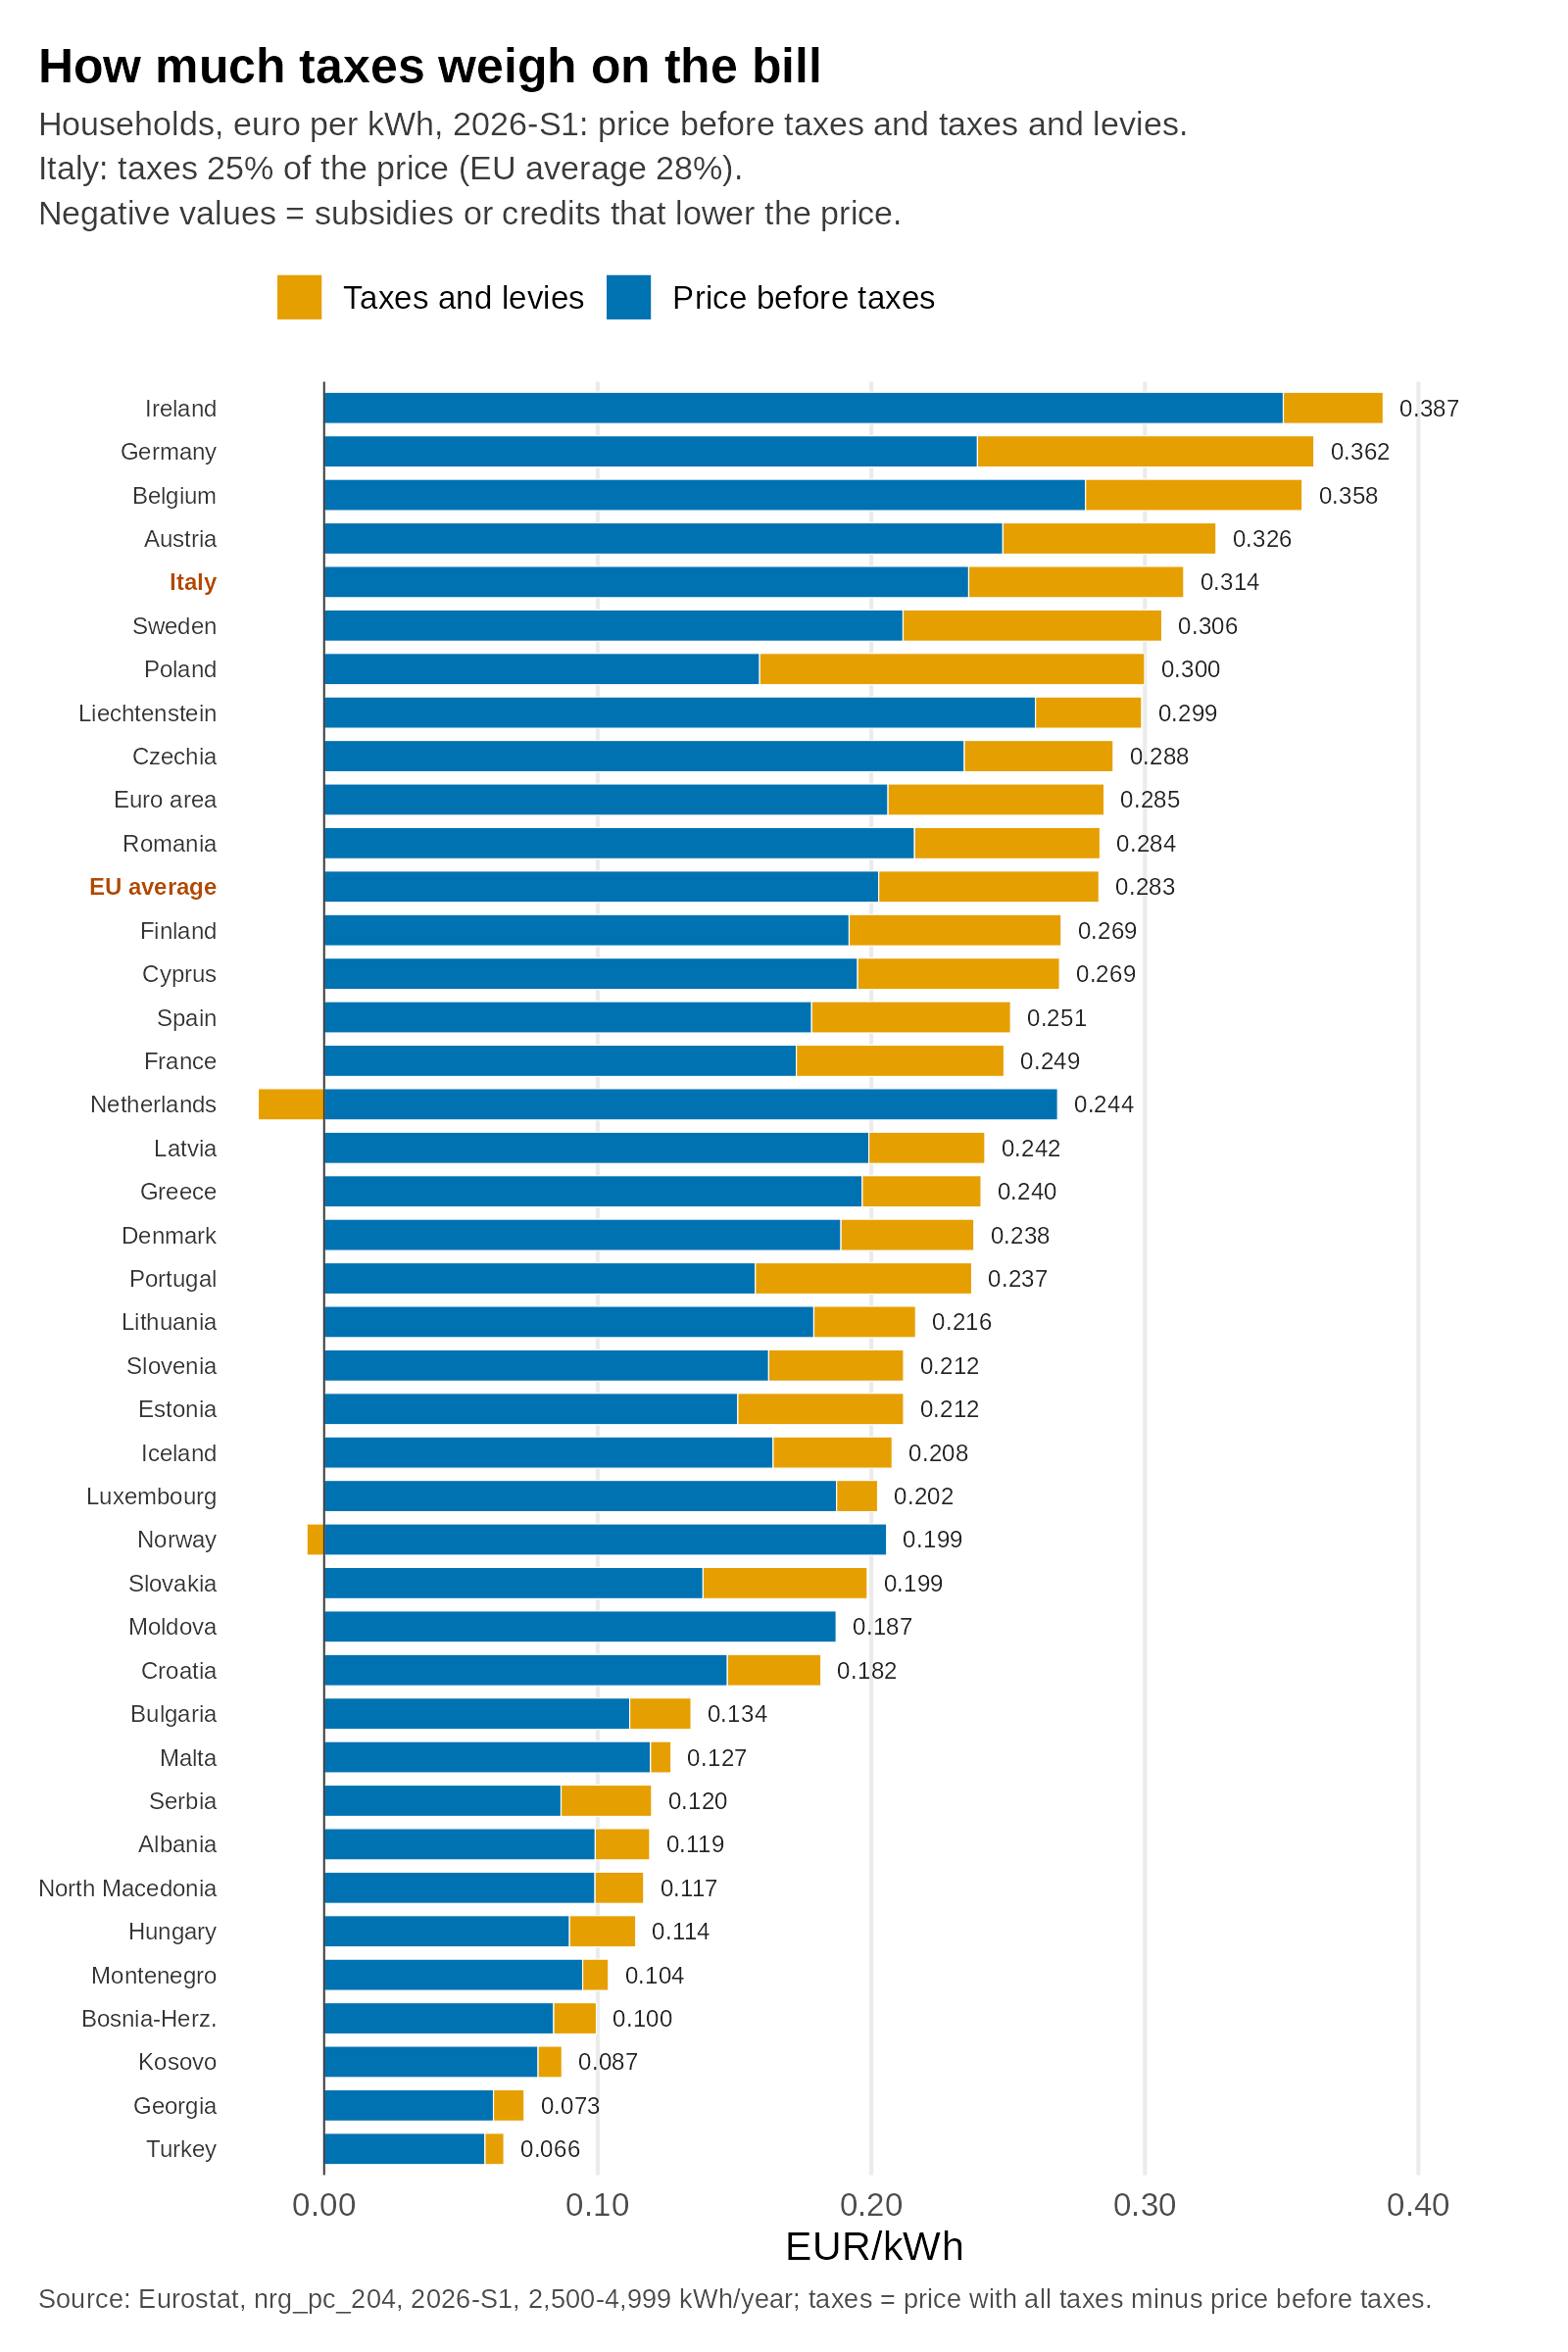
The first explanation that comes to mind is taxation. The data say it is not enough: in Italy, taxes and levies make up 25% of the electricity price for households, less than the European average (28.4%).

Even without taxes we remain among the most expensive: seventh out of 39 countries, with 0.236 euros per kWh against about 0.203 for the European average. Part of the bill, however, is not a tax in the strict sense: it is the system charges (oneri di sistema), the items that pay, among other things, for renewable incentives and the social bonus. The number I use is the price with all taxes and levies minus the price without, according to Eurostat’s definition (“taxes and levies”).

ARERA, the Italian energy authority, reaches the same conclusion on the comparison with the euro area: the gap comes almost entirely from the “energy” item, that is, from the price of electricity itself, before grid costs, charges and taxes. On the evolution in 2025 it adds something else: the final price for households fell by 1.6%, but charges and the tax component “neutralize” the possible savings.

An example of how a bill is divided. For a vulnerable customer on the regulated “maggior tutela” service, the service with prices set by ARERA, every 100 euros of the bill are divided like this from October 2026:

  • Energy: 63.7 euros
  • Grid: 14.2 euros
  • System charges: 7.6 euros
  • Retail (sales costs): 4.9 euros
  • Taxes: 9.6 euros

This is the breakdown after the quarter’s increase, and it is not everyone’s bill: it applies to vulnerable customers on the regulated service, about 3 million, and the open market (mercato libero) has different prices.

Bar chart by country of household electricity price, first half of 2026, euros per kWh, split into price without taxes and taxes and charges. Italy 0.314, taxes 25% of the price; EU average 0.283 (28%); Ireland 0.387, Germany 0.362.
Share of taxes and charges in the electricity price for households, first half of 2026. Source: Eurostat.

Gas and the Wholesale Price

What remains is the price of electricity before it reaches the bill: the wholesale price, the one at which suppliers buy it. The reference price is formed every day in the Day-Ahead Market, where electricity for the 24 hours of the next day is bought and sold hour by hour or, since October 2025, at fifteen-minute intervals.

Not all electricity goes through here: part is bought with forward contracts. The Ministry of the Environment and Energy Security (MASE) writes, in the National Integrated Energy and Climate Plan (PNIEC) of June 2024, that accepted offers are paid at the “system marginal price” (in Italian, “prezzo marginale di equilibrio”).

In plain words it works like this: power plants offer their energy, from the lowest offer to the highest, until the demand of that hour is covered. The last accepted offer, the highest of those that are needed, sets the price, and all accepted offers receive that price. An invented example, just to understand: if three plants are needed that offer at 30, 60 and 100 euros per megawatt-hour, all three are paid 100.

The mechanism is the same in much of Europe: what changes is which plant is the last one needed.

Why gas in particular? The three plants in the example could be solar, hydro or gas, in any order. The 2024 Plan states that combined-cycle gas plants have higher costs to run than, for example, the nuclear plants in other European countries. With higher costs, their offers are, in general, among the highest: for this reason, when they are needed, they are often the last offer.

The market is divided into zones, portions of the grid with limited exchange capacity, and each zone can have its own price. Until 2024, consumption was billed at the PUN (the national single price, prezzo unico nazionale), an average of the zonal prices. From January 1, 2025, the Italian energy markets operator (Gestore dei mercati energetici, GME) writes, purchases are paid at zonal prices, with a compensating component that realigns the cost with the PUN Index GME: what reaches consumers is, in effect, still the PUN Index. For simplicity I call it the PUN.

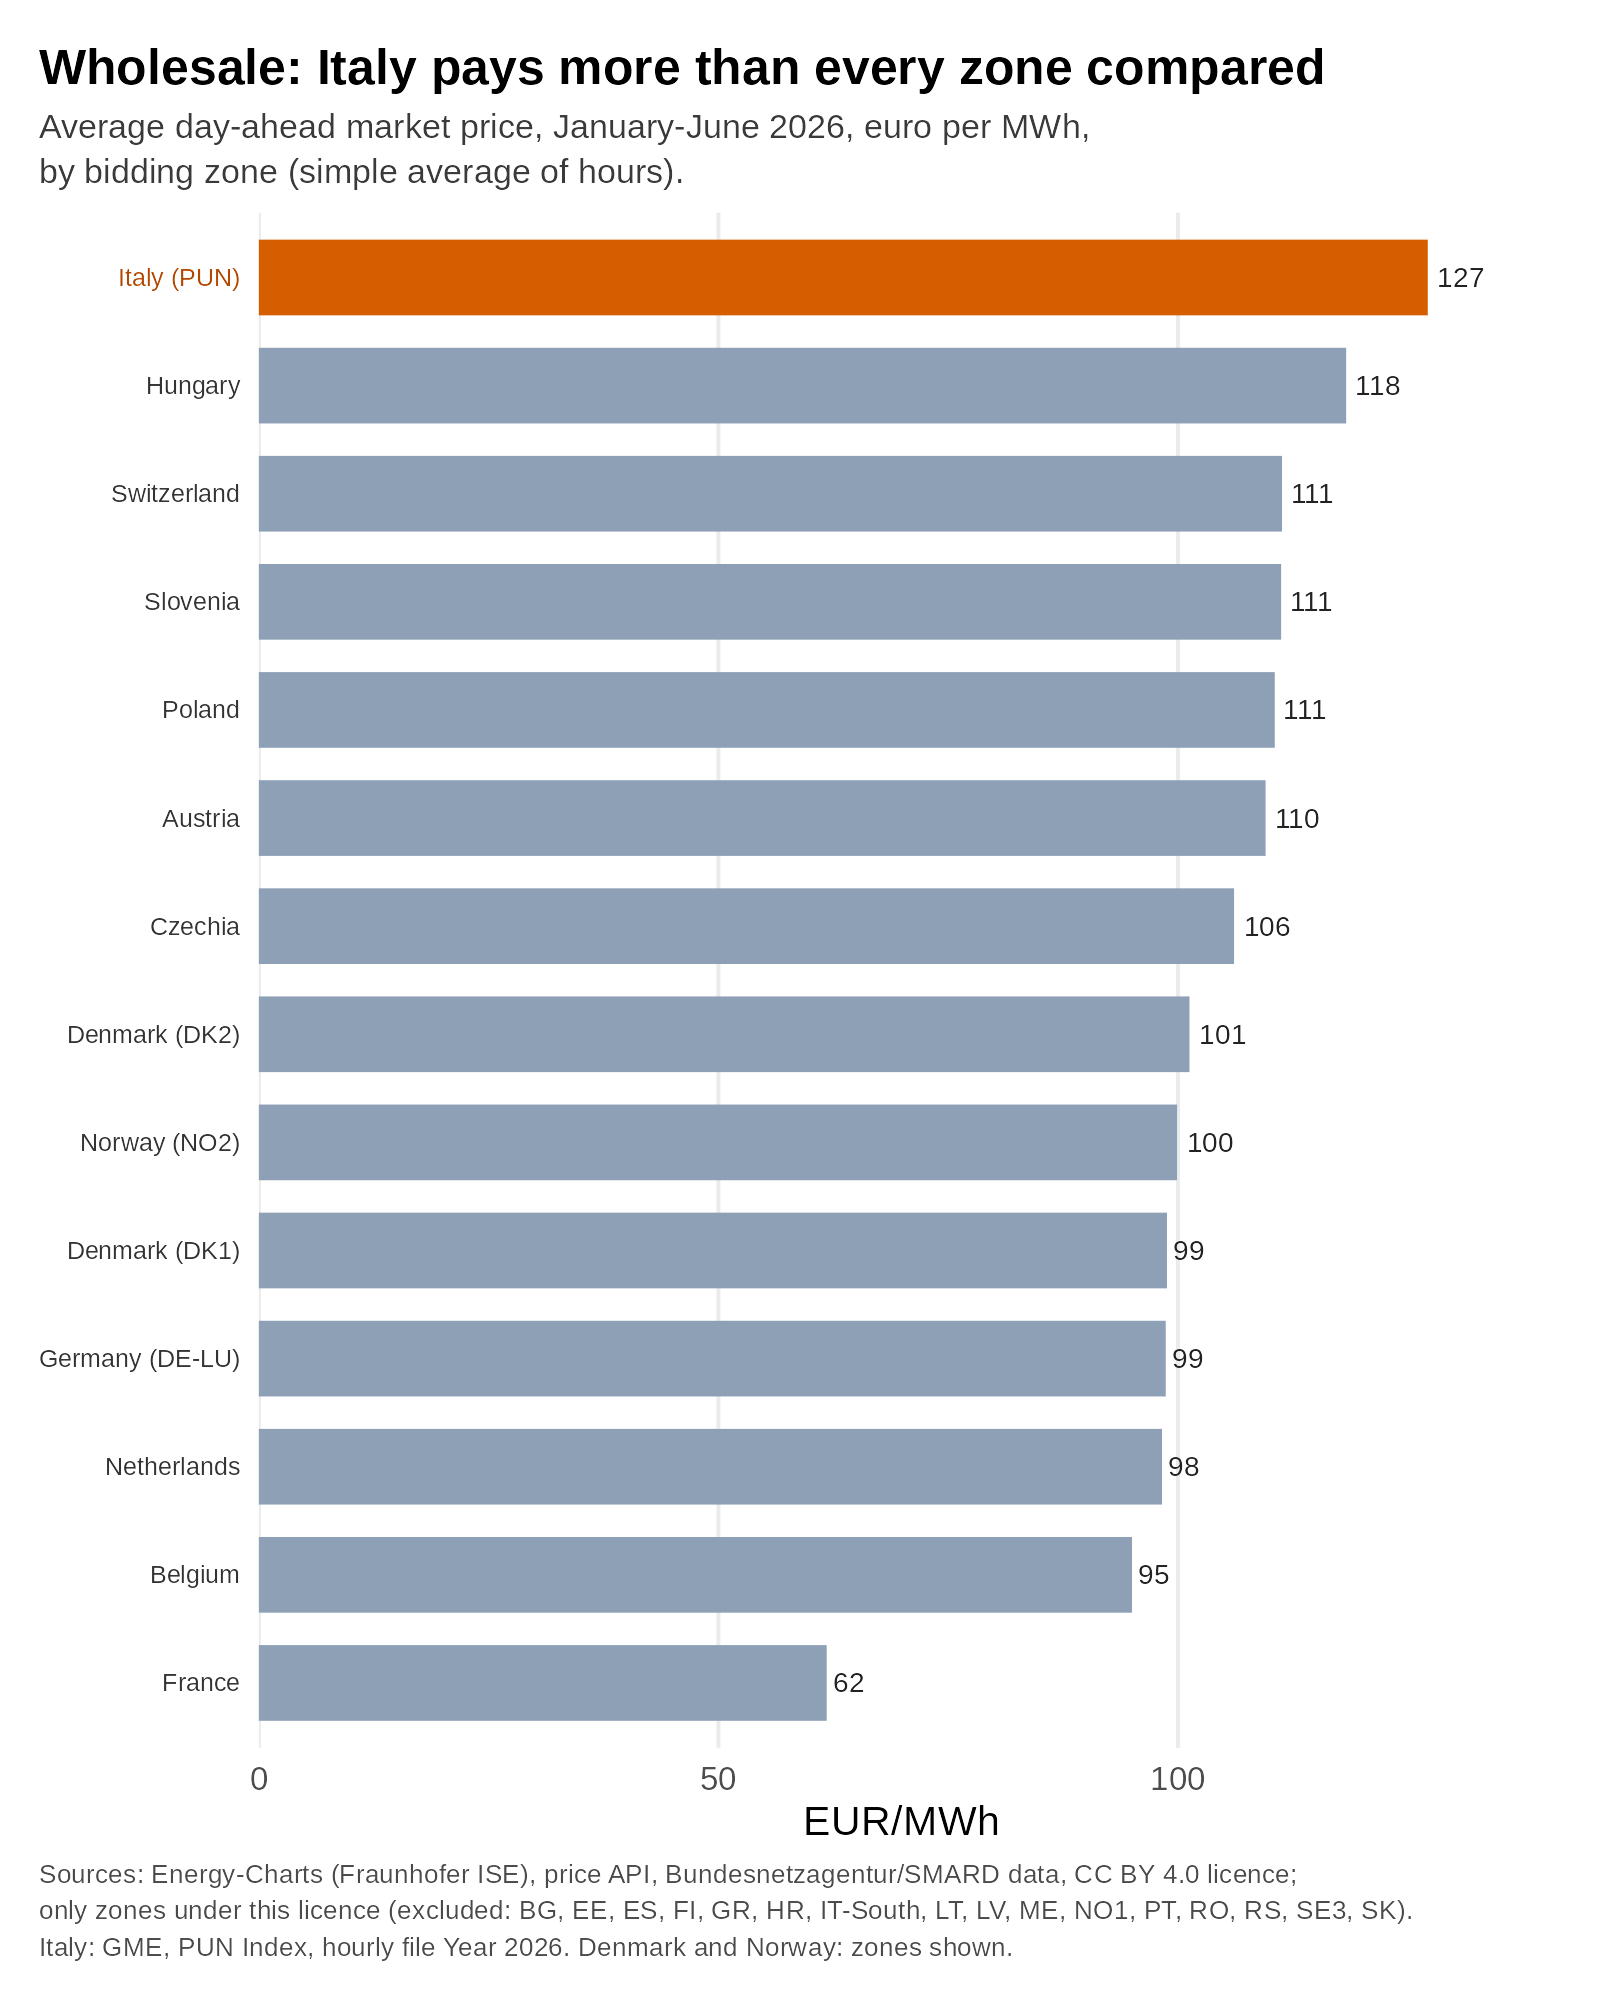
In the first half of 2026 the PUN averaged 127.2 euros per MWh (megawatt-hour, a thousand kWh): the highest among the 14 European market zones for which I have open-license data.

To compare it with the bill: 127.2 euros per MWh is about 12.7 euro cents per kWh, that is 0.127 euros per kWh. It is the price at which suppliers buy electricity, a part of the 31.4 euro cents of the bill: the rest includes other energy costs, grid costs, charges, taxes and sales. It is not the breakdown in the ARERA example above, which concerns vulnerable customers after the October increase: other customers and another period.

In Germany it was 98.7, in France 61.8. The gap with the European average is largely here. The figure is a simple average of the hours, from GME and Energy-Charts data.

Bar chart of average wholesale electricity price, January-June 2026, euros per MWh, by zone: Italy (PUN), in orange, is highest at 127; Hungary 118, Germany 99, France lowest at 62.
Average wholesale electricity price, January-June 2026, euros per MWh. Source: GME (Italy, PUN) and Energy-Charts (other zones with open license).

In 2025 as well, ARERA writes, the PUN was the highest among the main European exchanges: it indicates as the cause the strong dependence on gas-fired generation, the first factor in the wholesale price, and writes that prices remain “closely tied” to gas.

Gas really does play a big role: in 2025 Italy produced 47.4% of its electricity with gas. Among the 30 European countries Ember tracks, only Malta (83.1%) and Ireland (48.4%) did more, according to Ember, an energy research center.

The 2024 Plan also speaks of gas as “the main and marginal source for Italy”: marginal here means the plant at the margin, the one that sets the price, not a minor source.

One distinction is needed: one thing is how much electricity comes from gas, another is how often gas sets the price. The price is decided by the last offer that is needed, not by the most widespread technology.

To know how often gas sets the price, there is no single number. GME has an indicator of its own: for combined-cycle gas plants (plants that use the heat of combustion twice) it gives 61.4% in 2024 and 52.5% in 2025, that is, around half or a little more. The details of the method are in the note below.

The European Environment Agency (EEA) uses another method, and for the first 16 weeks of 2026 it gives 66% of the hours in Italy and 9% in Spain. The EEA writes that in those hours gas set the price, but its measure is a comparison: it counts the hours in which the day-ahead price is at least equal to the cost of producing with a gas plant.

The measures are different, over different periods.

Only the EEA’s allows the comparison with Spain, because it has the same method and the same period: in Italy the price reached the cost of gas in about two hours out of three, in Spain in 9% of the hours.

The two measures give a little more than half (GME, 2025) and two thirds (EEA, first 16 weeks of 2026): they are not the same number and should not be added together. Gas is not the only explanation I found in the official documents: ARERA examined another one, which I cover in a later article.

France, Spain, Germany

France produced 68.8% of its electricity with nuclear power in 2025, according to Ember, and paid on average about half the Italian price on the wholesale market.

Spain used gas for 22% of its electricity, against 47% for Italy.

Its 2025 wholesale price was about 67 euros per MWh, against 122 for Italy in the same Ember series.

These are comparisons, not proof: among these countries climate, hydropower, grid costs and regulated rates also differ, factors that the data do not measure.

Germany has a wholesale price lower than ours, 98.7 euros per MWh against 127.2, but higher bills: 0.362 euros per kWh. This means that other items weigh on the German bill.

On February 17, 2026, the German federal government described several measures as relief from energy prices, two of them on parts of the bill other than energy. Transmission grid fees are the part that pays for the power lines: in 2026 the government subsidizes them with 6.5 billion euros. The renewables levy is the item that finances the incentives: the state has already taken it on, 17 billion euros. These are two items that weigh on the German bill, alongside energy, and that the state says it pays in part.

The Title Only Partly Holds Up

The title of this article only partly holds up: we rank fifth, not first, for households, and Germany pays more.

It holds for electricity, not for all energy: for household gas, again according to Eurostat, we rank tenth, close to the European average (0.114 euros per kWh against 0.110), although in the second half of 2025 we were third.

And even for electricity the gap with the European average changes from one half-year to the next: it was 2% in the second half of 2025 and about 31% in the second half of 2022.

From August, Prices Rise Everywhere

For Italy, the Council of Ministers postponed on October 28 its examination of a decree-law on the cost of electricity and gas, which I cover here: the Council of Ministers press release no. 195 and the MASE’s 14 billion.

The February energy bills decree (Decree-Law 21/2026, converted into Law 49/2026) contains measures to reduce the cost of energy for households and businesses.

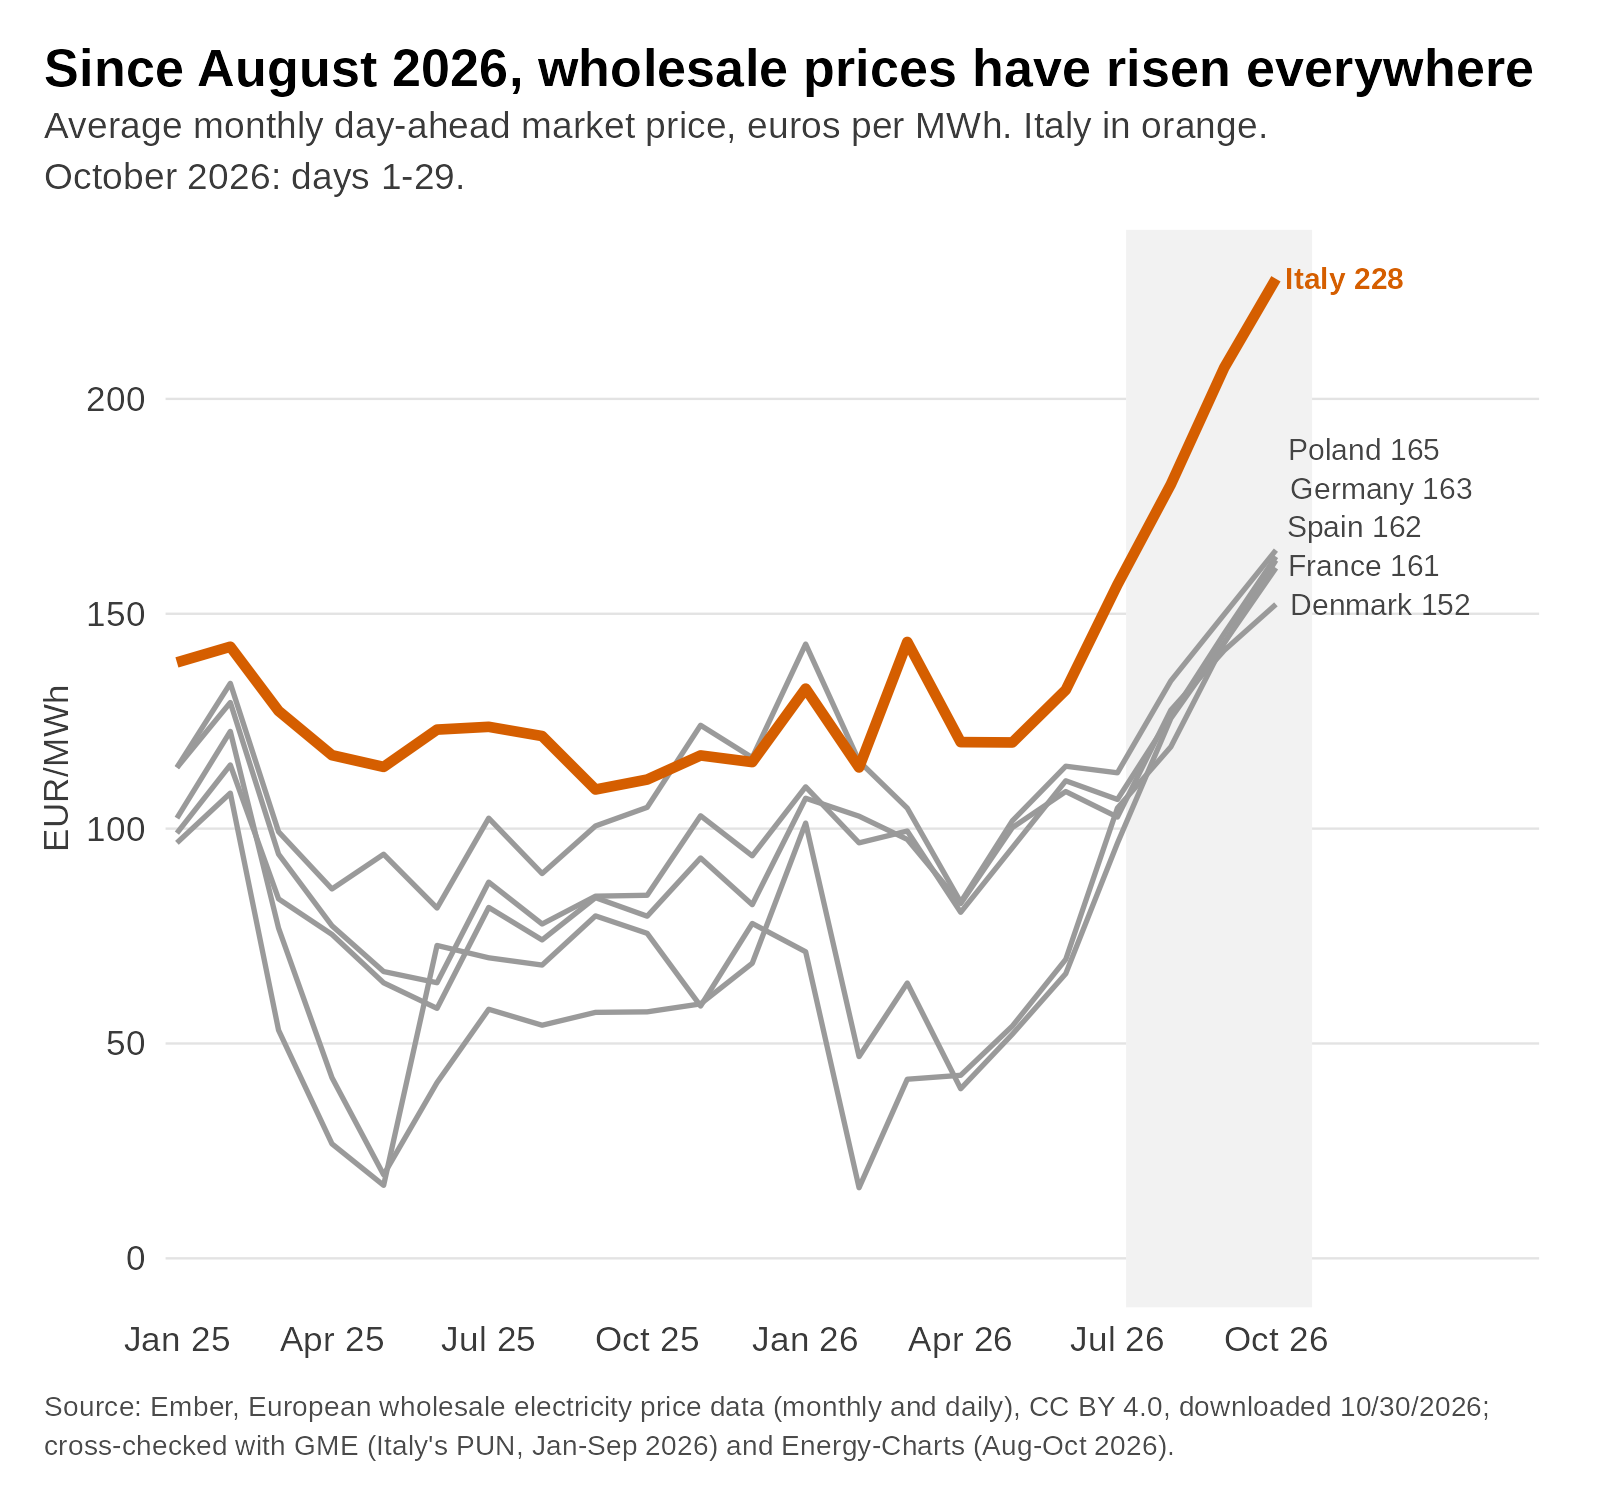
These comparisons have a date. Since August 2026 the wholesale price has risen in all 16 European countries Ember tracks, by a median of 54% between July and October.

In Italy it went from 157 euros per MWh in July to 228 in October, up to the 29th: 45% more, one of the smallest increases in percentage terms. But the October price is the third highest of the 16, after Hungary and Bulgaria.

France, Spain and Germany, which in July were between 97 and 107 euros, rose more and reached around 160. In France the rise was 66%: the French price, which in 2025 and in the first half of 2026 was about half ours, has been 70% of ours since August.

In euros the gap with France remains: 62 per MWh on average from August to October, against 58.5 in 2025. In percentage terms, therefore, the distance has narrowed; in euros it has not.

The rise follows the price of gas. From July to September wholesale gas rose by about 22 euros per megawatt-hour (ARERA, World Bank), and the price of electricity by 38 to 51 euros in Italy, Germany, Spain and France. For every extra euro on gas, Italian electricity gains about 1.8: that is what one expects from a gas plant that sets the price.

Gas rises with the Hormuz crisis. Since February 28, with the attack by the United States and Israel on Iran (Al Jazeera), the strait has been effectively closed (EIA). In March Italian gas rises by almost 50%. With the pause in fighting in April it stops rising: it stays between 46 and 47 euros per megawatt-hour until June, when the United States and Iran sign a preliminary agreement. It starts rising again in July, when the truce collapses and Qatari gas barely reaches Europe (ACER).

Heat and drought also weighed: less water and less nuclear power, more gas plants, with gas-fired generation in the Union up 20% in August (ACER). And countries with a lot of nuclear or hydropower rise too, such as France and Spain: in European markets, which are linked to one another, when gas moves a lot the price follows it there as well.

It is a strong and coherent association, not a measurement: ACER writes that higher gas costs put “substantial upward pressure” on electricity prices, but it does not say how much of the rise depends on Hormuz and how much on the rest. The MASE writes on October 16 that the aim of its new decree is to limit the effects of the rise in the price of gas on the cost of electricity.

Line chart of average monthly wholesale electricity price, January 2025 to October 2026, euros per MWh: Italy, in orange, rises to 228 in October; Poland 165, Germany 163, Spain 162, France 161, Denmark 152.
Average monthly wholesale electricity price, January 2025-October 2026 (October up to the 29th; July-October 2026 highlighted), euros per MWh. Source: Ember; Italy consistent with the GME PUN through September.

What Electricity Is Made From

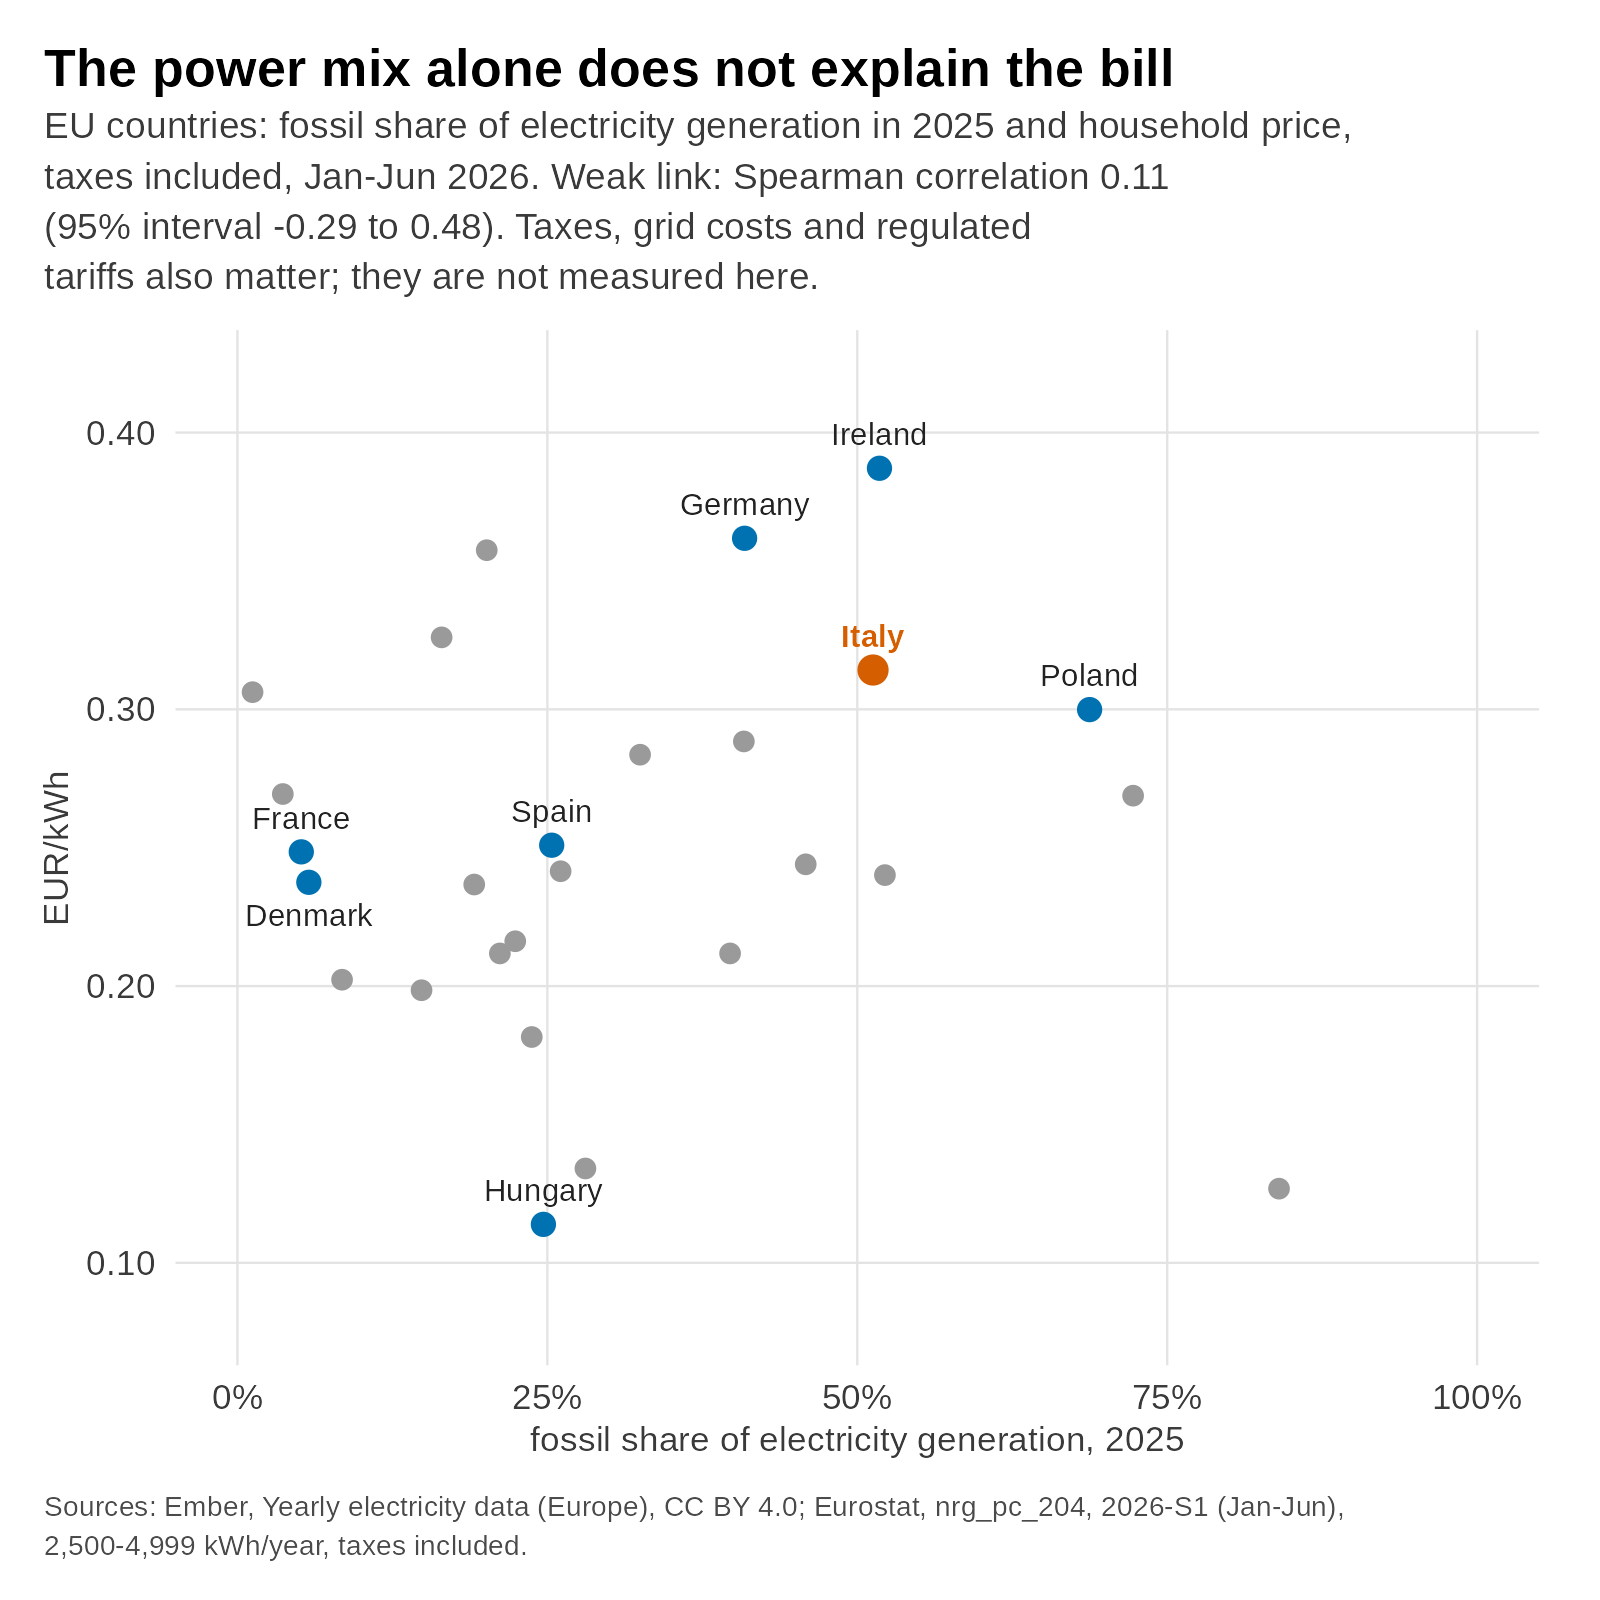
Among the 27 countries of the Union, the wholesale price tends to be higher where more fossil fuels (gas, coal, oil) are used, but the household bill is not necessarily higher: no clear link emerges. The energy sources weigh on the wholesale price; the bill also depends on other things, such as taxes, grid costs and regulated rates.

Scatter plot of EU countries: fossil share of electricity production in 2025 and household electricity price, first half of 2026. The points show a weak link (Spearman 0.11). Italy at 0.31 euros per kWh.
Share of fossil fuels in electricity production 2025 and household electricity price, first half of 2026, 27 countries of the Union. Source: Ember, Eurostat.

The bill, then, lies more in the energy we buy than in the taxes we pay on top of it, and gas, according to ARERA, is the first factor in the wholesale price.

But if gas matters so much, why is it precisely in the evening that Italy runs on gas?

In the Series

This is the first article in the series “But Why Do We Italians Pay So Much for Energy?” The answer to the question above is in the next article. After that: who pays for the transition, and what is still missing for wind, storage and rooftop solar.

Method Note (for Those Who Want to Check the Numbers)

Eurostat prices are national averages for standard consumption bands (households 2,500-4,999 kWh a year, businesses 500-1,999 MWh a year), not the average bill: fixed or variable contracts and bonuses are not separated. Switzerland and the United Kingdom are not included; for countries outside the euro, the exchange rate shifts prices. In the wholesale chart I left out the zones with a license that is not open. The wholesale average is simple, not weighted by volume.

Its public definition brings it closer to one built on volumes sold: for this reason it should not be compared with the EEA’s 66%, which counts hours.

Sources

Accessed October 30, 2026. I mark the type of each source: primary (the body that produces the data), analysis (the newsroom on primary data), secondary.

  1. Eurostat, electricity prices for households (nrg_pc_204, band 2,500-4,999 kWh a year), first half of 2026, data updated to October 19, 2026. Primary; newsroom analysis. https://ec.europa.eu/eurostat/api/dissemination/statistics/1.0/data/nrg_pc_204
  2. Eurostat, electricity prices for businesses (nrg_pc_205, band 500-1,999 MWh a year), first half of 2026. Primary; newsroom analysis. https://ec.europa.eu/eurostat/api/dissemination/statistics/1.0/data/nrg_pc_205
  3. ARERA, press release “I numeri dei servizi pubblici” (Annual Report 2025), July 1, 2026. Primary. https://www.arera.it/fileadmin/allegati/com_stampa/26/Comunicato_stampa_ARERA__I_numeri_della_Relazione_Annuale_2025.pdf
  4. ARERA, Annual Report, presentation by the President, July 1, 2026. Primary. https://www.arera.it/fileadmin/allegati/relaz_ann/26/discorso_presidente_DIGITAL.pdf
  5. ARERA, press release “Elettricità maggior tutela +37,3% nel IV trimestre 2026 per i clienti vulnerabili” (electricity, regulated service, +37.3% in the fourth quarter of 2026 for vulnerable customers), September 29, 2026. Primary. https://www.arera.it/fileadmin/allegati/com_stampa/26/Comunicato_stampa_ARERA_aggiornamento_Maggior_Tutela_IV_TRIM_2026.pdf
  6. ARERA, Report 301/2026/I/EFR, August 6, 2026 (gas as the first factor in the PUN). Primary. https://www.arera.it/fileadmin/allegati/docs/26/301-2026-I-efr.pdf
  7. GME, MGP Results, Historical Data, “Anno 2026” file (hourly PUN Index). Primary; newsroom analysis. https://www.mercatoelettrico.org/it-it/Home/Esiti/Elettricita/MGP/Statistiche/DatiStorici
  8. Energy-Charts (Fraunhofer ISE), day-ahead prices by market zone, January-June 2026 and August-October 2026, CC BY 4.0 license. Primary; newsroom analysis. https://api.energy-charts.info/price
  9. Ember, “European wholesale electricity price data” (monthly and daily, through October 29, 2026) and annual electricity data for Europe (file of June 17, 2026), CC BY 4.0 license. Secondary (analysis by a research center on ENTSO-E data); newsroom analysis. https://ember-energy.org/data/european-wholesale-electricity-price-data/
  10. German federal government, “Energy price relief measures take effect,” February 17, 2026. Primary. https://www.bundesregierung.de/breg-en/news/reduction-in-energy-prices-2358994
  11. Ministry of the Environment and Energy Security, National Integrated Energy and Climate Plan (PNIEC, the ministry’s document), final version, June 2024 (file of July 1, 2024), par. 4.5.3 (p. 419) and p. 171. Primary. https://www.mase.gov.it/portale/documents/d/guest/pniec_2024_revfin_01072024-pdf
  12. GME, Annual Report 2024 (move to the PUN Index GME from January 1, 2025; ITM indicator for combined-cycle plants, 61.4%). Primary. https://www.mercatoelettrico.org/Portals/0/Documents/it-IT/Gme_RelazioneAnnualeWeb_2024.pdf
  13. GME, Annual Report 2025 (June 2026; ITM indicator for combined-cycle plants, 52.5% in 2025). Primary. https://www.mercatoelettrico.org/Portals/0/Documents/it-IT/Gme_RelazioneAnnualeWeb_2025.pdf
  14. GME, glossary (marginal offer, equilibrium price, ITM indicator). Primary, undated. https://www.mercatoelettrico.org/en-us/Home/Glossary
  15. European Environment Agency (EEA), Briefing 18/2026, “Renewable electricity – best buffer against gas price volatility,” July 2, 2026. Primary (European Union agency). https://www.eea.europa.eu/en/analysis/publications/renewable-electricity-buffering-gas-prices
  16. Ministry of the Environment and Energy Security, note on the energy bills decree, October 16, 2026. Primary. https://www.mase.gov.it/portale/-/dl-bollette-pichetto-accordo-politico-preliminare-con-l-ue-
  17. Eurostat, gas prices for households (nrg_pc_202), second half of 2025 and first half of 2026. Primary; newsroom analysis. https://ec.europa.eu/eurostat/api/dissemination/statistics/1.0/data/nrg_pc_202
  18. ARERA, wholesale gas prices at the PSV, monthly average (table “Valore CMEMm – Servizio di tutela della vulnerabilità”), January 2024-September 2026. Primary; newsroom analysis. https://www.arera.it/area-operatori/prezzi-e-tariffe/valore-cmemm-vulnerabili
  19. World Bank, Commodity Price Data (Pink Sheet), updated October 2, 2026 (TTF, the price of gas in Europe). Primary; newsroom analysis. https://thedocs.worldbank.org/en/doc/74e8be41ceb20fa0da750cda2f6b9e4e-0050012026/related/CMO-Historical-Data-Monthly.xlsx
  20. EIA, “International LNG prices rise amid Strait of Hormuz closure,” April 28, 2026. Primary. https://www.eia.gov/todayinenergy/detail.php?id=67604
  21. ACER, “Key developments in European gas wholesale markets – summer 2026,” October 2026. Primary. https://www.acer.europa.eu/monitoring/key-developments-european-gas-wholesale-markets-summer-2026
  22. Al Jazeera, “Strait of Hormuz: What has happened since the US-Iran MoU on June 17?,” July 9, 2026 (the February 28 attack, the preliminary agreement, the end of the truce as declared by the U.S. president). Secondary. https://www.aljazeera.com/news/2026/7/9/strait-of-hormuz-what-has-happened-since-the-us-iran-mou-on-june-17
  23. Al Jazeera, “Shipping in Strait of Hormuz at a standstill despite US-Iran ceasefire,” April 10, 2026 (the pause in fighting in April). Secondary. https://aljazeera.com/economy/2026/4/10/shipping-in-strait-of-hormuz-at-a-trickle-despite-us-iran-ceasefire