
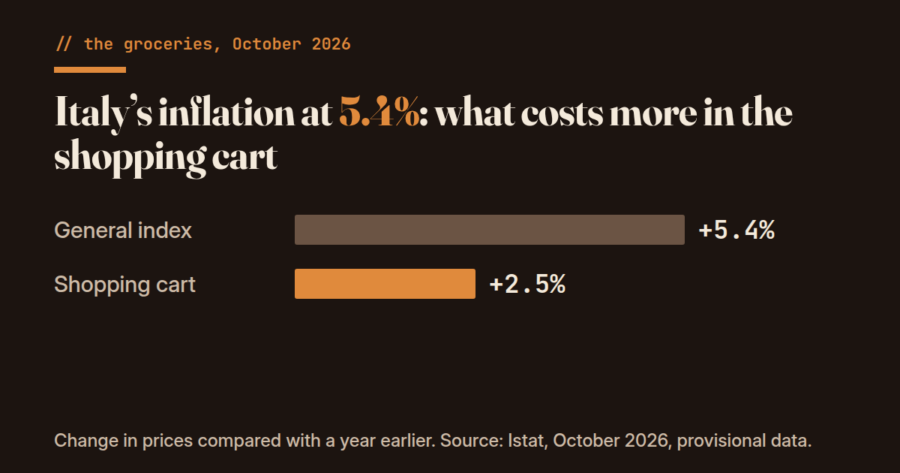
In October, inflation stood at 5.4%, according to Istat, Italy’s national statistics office: prices are 5.4% higher than a year earlier. The data are provisional, and Istat writes that inflation is back at the level of August 2023.
It is the number that ends up in the headlines. But in the shopping cart, at the supermarket, what has really gone up?
To answer, I have lined up six things: what the 5.4% measures, what has gone up on the dinner table, what is not rising, why prices are rising, whether vegetables explain inflation, and what is still not known.
What does the 5.4% measure?
The general index measures the price of everything we buy: groceries, utility bills, gasoline, rent, travel, restaurants. Each item weighs as much as we spend on it.
The “shopping cart” is only what you buy at the supermarket: food, detergents and household products, soap and personal-care products. It is about one-fifth of household spending. Utility bills and gasoline are not in it.
In October, compared with a year earlier, according to Istat:
- General index: +5.4% (September +4.2%).
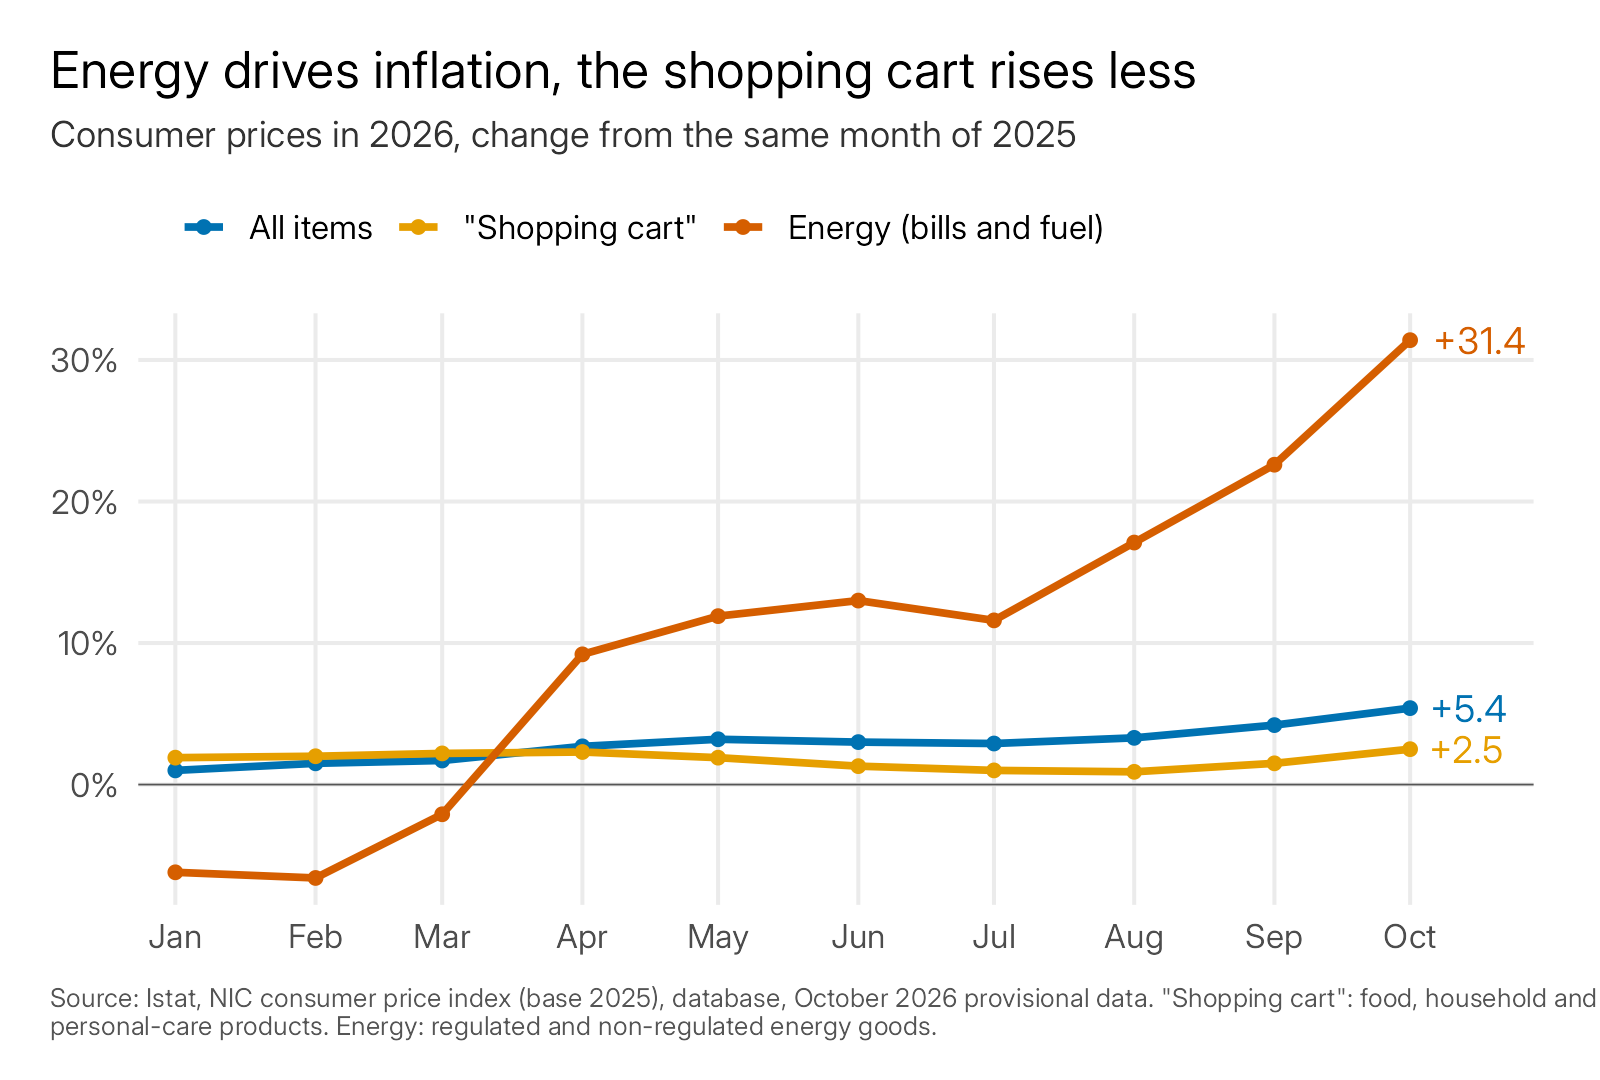
- Energy (utility bills, fuels, heating oil): +31.4%.
- Shopping cart: +2.5% (September +1.5%).
Of the 5.4 percentage points of inflation, about 3 come from energy, which is more than half. The calculation is in the methodology note. The shopping cart rose by less than half as much as the general index. I wrote about utility bills in “But Why Do We Italians Pay So Much for Energy?”: here the focus is groceries.
What has gone up on the dinner table?
Four products that people buy often and that are rising faster than the shopping cart, compared with October 2025 (Istat, database, provisional data):
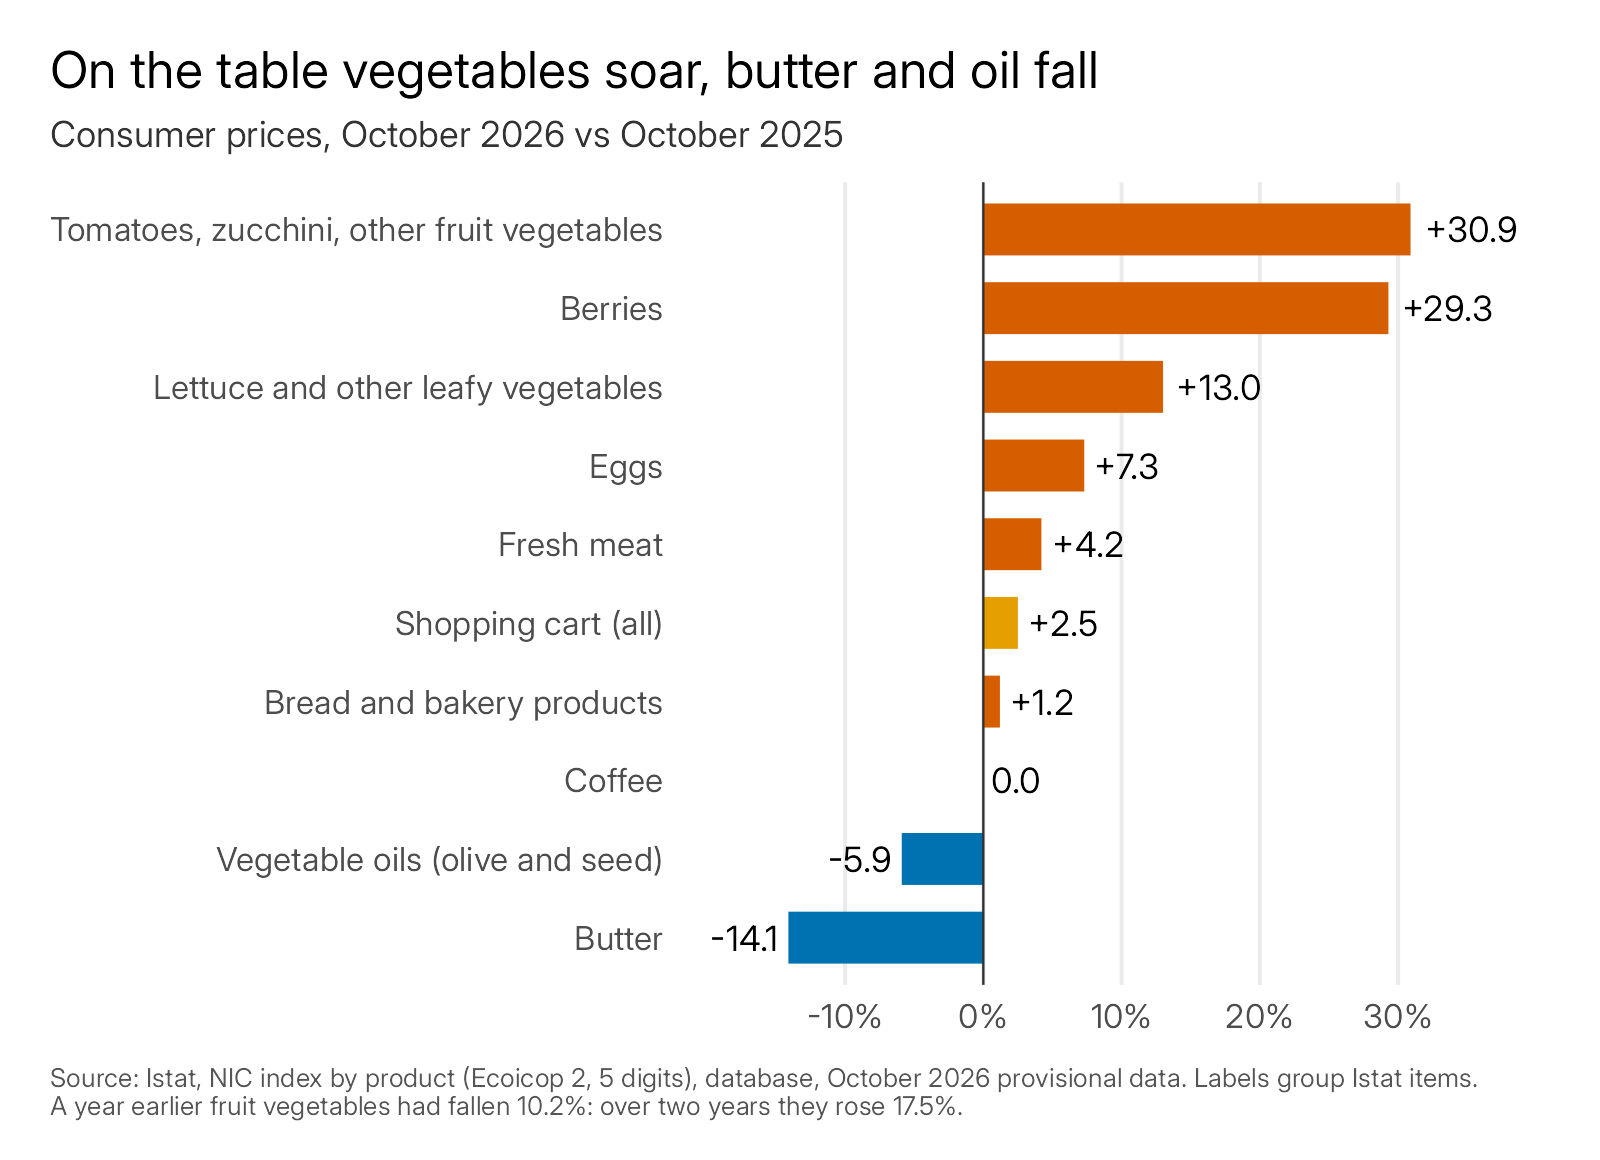
- Fruiting vegetables: +30.9% (tomatoes, peppers, eggplants, zucchini and the like).
- Lettuce and other leafy greens: +13.0%.
- Eggs: +7.3%.
- Fresh meat: +4.2%.
Vegetables have only just taken off. Fruiting vegetables were at +16.3% in September and are at +30.9% in October. Eggs have been stable since the start of the year, between +7.3% and +8.8%; meat is slowing, from +6.7% in January to +4.2%.
A year ago, fruiting vegetables had fallen 10.2%: compared with two years ago, the increase is 17.5%. Jumps like this have happened before: in October 2022 they were at +30.1%.
Fresh legumes (+11.7%) and potatoes (+7.2%) are also rising; dried legumes hardly move (+0.6%). Berries are at +29.3%, but they weigh little, about one-thousandth of spending.
On November 1, ANSA, Italy’s leading news agency, ran the headline “zucchini +31% in October,” citing Assoutenti, a consumer association, which adds: “Italy is quickly returning to the levels of the 2022 crisis.”
I checked the Istat data: that +31% is the entire category of fruiting vegetables (tomatoes, zucchini, peppers, eggplants and the like), not zucchini alone. In September, according to Istat, tomatoes were at +19.3% and zucchini at +12.5%; the October detail will come out with the final data.
What is not rising?
Not everything goes up. Compared with a year ago:
- Butter: −14.1%.
- Olive and seed oils: −5.9%.
- Coffee: 0.0%. In January it was up 15.9%: the price increase has stopped.
- Bread and baked goods: +1.2%, less than the shopping cart.
In autumn, the cart rises because of fresh food and not packaged products. Unprocessed foods, meaning fresh fruit, vegetables, meat and fish, are at +7.5%. Processed ones, such as pasta, milk, cheese and cured meats, are at −0.2%.
Why are prices rising?
There is more than one cause: energy, the heat and a comparison with a year of low prices are facts; the war’s effect on food prices and the truckers’ strike are claims made by associations.
The war in the Middle East, for electricity and gas. Istat writes that the acceleration in inflation reflects mainly the increase in energy goods, from +22.6% to +31.4%, “still influenced by the international geopolitical situation.” The link runs through three things:
- The Strait of Hormuz: the sea passage through which about one-fifth of the world’s liquefied natural gas (LNG) passes, mostly from Qatar, was closed from February 28, the EIA, the U.S. Energy Information Administration, wrote on April 28. LNG is gas cooled until it becomes liquid, so that it can travel by ship.
- Qatar: according to ACER, the European agency of energy regulators, the strait remained largely blocked during the summer, and no significant volumes of Qatari LNG reached Europe.
- Storage: the gas reserves held in storage facilities: according to ACER they were at 28% of capacity at the end of winter and refilled slowly, reaching 75% on October 21.
Gas and electricity on the regulated-price service (the “tutelato” market) are up, according to Istat, by 56.8% and 60.2%.
For groceries, according to ANSA, Assoutenti links the war to the price increases: “There is no sector that is not feeling the effects of the war,” says its president, Gabriele Melluso. For vegetables, Assoutenti offers no data on this link, and Istat names no causes for individual products.
Diesel and fertilizers. For farmers they cost much more: fuels +53.3% and fertilizers +13.4% in a year, according to Ismea, the institute for agricultural market services; diesel for transport +37.7%, according to Istat (consumer price). But in the prices of packaged food they do not show up yet (−0.2%).
In the 2022 crisis, energy price increases reached food prices after about 11 months. That is a single episode, not a forecast. The Unione nazionale consumatori, another consumer association, sees a first sign in processed products, +0.5% compared with September. Christine Lagarde, president of the European Central Bank (ECB), told the European Parliament on June 22, speaking about food prices: “we are likely to see that in the course of 2027 more than in the course of 2026.”
Heat and low prices a year ago. On the heat, there are three voices:
- Coldiretti, which represents farmers: the summer caused damage of more than €3 billion (first estimate, August 11).
- Cia, an Italian farmers’ association (not the U.S. agency): yields were estimated in September at about 15% below the average of the last five years.
- CNR, Italy’s National Research Council: it was the hottest summer since 1950.
In addition, in October 2025 fresh vegetables had fallen 6.4%, according to Istat: the comparison starts from a low level. At the producer level, according to Ismea, tomatoes, peppers and eggplants cost much more than a year ago; zucchini do not (0.0%).
The truckers’ strike. Starting October 16, with stoppages declared through the 20th, truckers and farmers in southern Italy blocked roads over the cost of fuel, writes L’Espresso; the market in Vittoria, in Sicily, stayed empty from the 16th, writes Il Post. The Unione nazionale consumatori ties it to the rise in citrus prices; for October’s vegetables, Istat does not say so.
What about U.S. natural gas? It is a fact that the United States supplies about 30% of the gas the European Union imports, according to ACER, mostly as LNG, sold at European market prices. Euronews, reporting on a study by the IEEFA, a research institute on energy economics and finance, writes that bringing it here generally costs more than pipeline gas, because of liquefaction, shipping and regasification. To explain the autumn increase, ACER points to something else: Qatari LNG almost absent from Europe in the summer, low storage, and the heat, which led to more gas being used to produce electricity.
Do vegetables explain inflation?
No. Four of the biggest increases (fruiting vegetables, berries, leafy greens and eggs) together account for about 0.3 points of the 5.4. Energy accounts for more than 3.
Fresh meat rises “only” 4.2%, but it accounts for 0.10 percentage points of the 5.4, more than half of 0.17, the figure for fruiting vegetables, because much more of it is bought. Vegetables make the news; the weight in the household budget is something else.
What is still not known?
The October data are provisional. Istat publishes the final data on November 17, and the figures may change by a few tenths.
The detail for each individual vegetable, for October, will come out only then, and it will also say whether the vegetable jump recedes.
All that remains is to see, on November 17, what the final data say.
Frequently asked questions
What is the 5.4% everyone is talking about?
It is the change in consumer prices in October 2026 compared with October 2025, according to Istat, and it is a provisional figure. It is the general index: it includes groceries, utility bills, gasoline, rent, travel and restaurants, each with the weight it has in household spending. Istat writes that it is the level of August 2023.
How much have prices risen in the shopping cart?
The shopping cart rose 2.5% in October 2026 compared with a year earlier (September +1.5%), according to Istat. It includes food, household products and personal-care products. That is less than half of the general index, +5.4%, because energy weighs on the latter: utility bills, fuels and heating oil, at +31.4%.
Which products that people buy often have gone up the most?
According to Istat, in October 2026 compared with a year earlier: fruiting vegetables +30.9%, lettuce and other leafy greens +13.0%, eggs +7.3%, fresh meat +4.2%. Butter (−14.1%) and olive and seed oils (−5.9%) are falling. The data are provisional: the final ones come out on November 17.
Do vegetables explain inflation?
No. Four of the biggest increases (fruiting vegetables, berries, leafy greens and eggs) together account for about 0.3 points of the 5.4. Energy accounts for more than 3. The calculation is each item’s weight in household spending, according to Istat, multiplied by how much it rises.
When do the final data come out?
Istat publishes the final data on November 17, 2026. The October figures are provisional and may change by a few tenths. The detail for each individual vegetable will come out only then.
Methodology note (for those who want to check the math)
The index is the NIC, Italy’s consumer price index for the whole population, calculated by Istat on a 2025 base. For U.S. readers: Istat is Italy’s national statistics office, and the NIC is the Italian counterpart of the CPI; it is not the U.S. CPI. According to Istat’s release, the EU-harmonized index of consumer prices (HICP) was +5.6% in October. The changes are against October of the previous year. An item’s contribution to the 5.4% is obtained by multiplying its weight in spending by its change: energy weighs 10.5% of spending and rises 31.4%, and 10.5 times 31.4, divided by 100, makes about 3.3 points of the 5.4, or about 60%. Istat’s exact calculation (figure 4 of its release) gives about 2.8 percentage points for non-regulated energy and 0.4 for regulated energy, or about 3.2.
The 11-month lag between energy and food comes from Istat’s 2021-2023 series: a single episode, in which the war in Ukraine and grain prices were also at work.
Quotations from Italian-language sources are my translations.
Sources
Accessed November 2, 2026. I mark the type of each source: primary (whoever produces the data), derived (calculated from primary data), secondary. Titles of Italian sources are in the original, with an English translation in brackets.
- Istat, release “Prezzi al consumo, dati provvisori ottobre 2026” [“Consumer prices, provisional data October 2026”], October 30, 2026. Primary. https://www.istat.it/comunicato-stampa/prezzi-al-consumo-dati-provvisori-ottobre-2026/
- Istat, consumer price database (NIC, 2025 base, Ecoicop 2 classification; 2026 weights), accessed November 2, 2026. Primary; derived from primary data. https://esploradati.istat.it/
- ANSA, “Assoutenti, la guerra fa schizzare i prezzi, zucchine +31% a ottobre” [“Assoutenti: the war sends prices soaring, zucchini +31% in October”], November 1, 2026, 11:18 a.m. Secondary; Assoutenti is an interested party. https://www.ansa.it/sito/notizie/economia/2026/11/01/assoutenti-la-guerra-fa-schizzare-i-prezzi-zucchine-31-a-ottobre_7b2133da-31b8-4378-9111-9db270ef23d7.html
- Ismea, production input price indices, September 2026, and producer prices, fourth week of October 2026. Primary. https://www.ismeamercati.it/flex/cm/pages/ServeBLOB.php/L/IT/IDPagina/4286
- ACER, “Key developments in European gas wholesale markets – summer 2026,” October 27, 2026 (Qatar, gas imports from the United States and Russia). Primary. https://www.acer.europa.eu/monitoring/key-developments-european-gas-wholesale-markets-summer-2026
- EIA, “International LNG prices rise amid Strait of Hormuz closure,” April 28, 2026. Primary. https://www.eia.gov/todayinenergy/detail.php?id=67604
- Il Post, “Perché mancano ortaggi, insalata e pomodori” [“Why vegetables, lettuce and tomatoes are in short supply”], September 23, 2026; article on the Vittoria market, October 21, 2026. Secondary. https://www.ilpost.it/2026/09/23/mancano-ortaggi-insalata-pomodori-perche/
- Coldiretti, release on heat damage above €3 billion (first estimate), August 11, 2026, https://www.coldiretti.it/economia/caldo-danni-da-clima-superano-i-3-miliardi-calamita-nei-campi ; Teleborsa, “Caldo: Cia, al settore un conto da oltre 2 miliardi. Rese agricole stimate a -15%” [“Heat: Cia, a bill of over €2 billion for the sector. Yields estimated at -15%”], September 3, 2026, https://www.teleborsa.it/News/2026/09/03/caldo-cia-al-settore-un-conto-da-oltre-2-miliardi-rese-agricole-stimate-a-15percent-187.html ; AGI, “Estate 2026 la più calda dal 1950, temperatura media record di 24,3 °C” [“Summer 2026 the hottest since 1950, record average temperature of 24.3 °C”], September 7, 2026, https://www.agi.it/cronaca/news/2026-09-07/clima-cnr-estate-calda-38923549/ . Secondary; Coldiretti and Cia are interested parties.
- L’Espresso, Paolo Tomasi, “Continua la protesta degli autotrasportatori. Nuovi presidi sulle autostrade in tutto il Sud Italia, bloccati i porti in Sicilia” [“The truckers’ protest continues. New pickets on highways across Southern Italy, ports blocked in Sicily”], October 19, 2026, https://lespresso.it/c/attualita/2026/10/19/proteste-autotrasportatori-blocchi-autostradali-sud-italia-campania-calabria-sicilia-basilicata-puglia/65365 . Secondary.
- Unione nazionale consumatori, release on October inflation, October 30, 2026. Secondary; the association is an interested party. https://www.consumatori.it/comunicati-stampa/inflazione-16/
- Eunews, Emanuele Bonini, “Lagarde: «L’inflazione alimentare si presenterà nel 2027»” [“Lagarde: ‘Food inflation will show up in 2027’”], June 22, 2026 (hearing of the ECB president before the European Parliament’s Committee on Economic and Monetary Affairs), https://www.eunews.it/2026/06/22/lagarde-linflazione-alimentare-si-presentera-nel-2027/ . Secondary. Primary source: ECB, “Monetary Dialogue with Christine Lagarde,” transcript of the hearing, June 22, 2026, p. 12, https://www.ecb.europa.eu/press/key/date/2026/html/ecb.sp260622_annex1~7c2171811a.en.pdf . Primary.
- Euronews, Quirino Mealha, “Two-thirds of Europe’s LNG imports to come from the US amid increased reliance,” May 13, 2026, which reports on an IEEFA report. Secondary. https://www.euronews.com/2026/05/13/two-thirds-of-europes-lng-imports-to-come-from-the-us-amid-increased-reliance