Espresso Code: Italian Dev Insights

Insights and guides from an Italian passionate developer

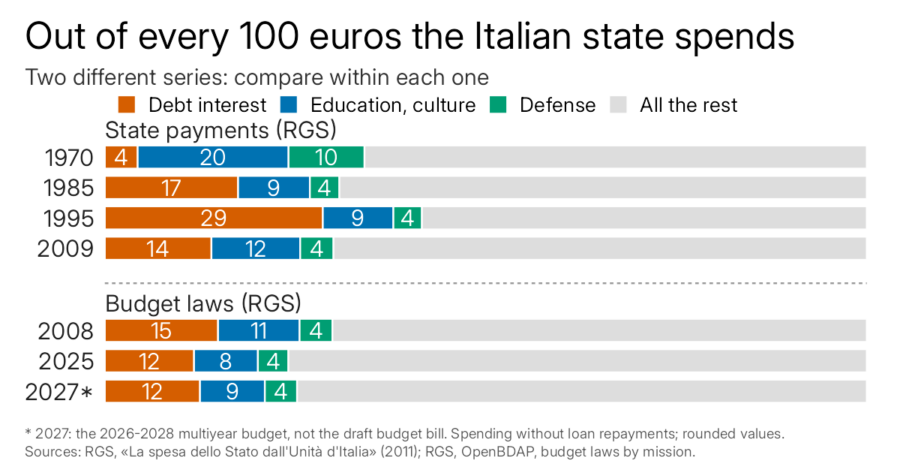
Of every hundred euros of state spending, interest goes from 4 in 1970 to 29 in 1995 and 14 in 2009 (payments), then from 15 in 2008 to 12 in 2025 and 2027 (budget laws). The two series are not compared with each other.

Italy’s State Spending From 1970 to Today: Where the Money Goes, Sector by Sector

In 1970, interest on the debt was 4.3% of the Italian state’s spending; between 1993 and 1996, about 28%. What happened in between, and where does the state’s money go today, sector by sector?

To answer, I put together three series of official data on the Italian state’s spending by sector. A series records the same measure year after year; these cover different periods, include different things and cannot be joined into one. Alongside the numbers I set the historical facts that the sources document, in nine steps: from the change of currency to the limits of the numbers.

How do you compare fifty years of spending, across lire and euros?

Until 2001, the state’s accounts were in lire. The official series have already converted them into euros at the fixed rate of 1,936.27 lire to the euro: the unit changes, not the purchasing power. That is why I use percentages here, which do not depend on the currency: of every hundred euros the state spends in a year, how many go to each sector.

The total on which I calculate the percentages is final spending: everything the state spends, without the repayment of government bonds (the loans the state takes from people who buy Italian government bonds such as BOT and BTP) that come due, which is not a spending choice. Interest on the debt, instead, is real spending and stays a sector of its own.

A single homogeneous series from 1970 to 2027 does not exist. There are three series, and each measures something different:

SeriesWhat it measuresYears
State budget by functional category, that is, by purpose, such as defense or education (RGS, the State General Accounting Office, Ragioneria generale dello Stato)the state’s payments: the money that actually went out1970-2009
Budget law by mission, that is, by major purpose (RGS)the state’s initial appropriations: how much the law authorizes spending at the start of the year2008-2027
Spending of all levels of general government by function (Istat and Eurostat, COFOG classification, that is, the international classification of the functions of general government)the spending of the state, regions, municipalities and social security institutions together1995-2024

The three series are not joined. In 2008 and 2009 the first two overlap and give different levels: in the second, for example, general administration weighs about 7.5-7.7 percentage points more (percentage points: the distance between two percentages; from 10% to 12% is 2 points). So levels before and after 2008 are not compared; trends within each series, yes.

2027 is the second year of the 2026-2028 multiyear budget, already approved (not a proposal).

Of every hundred euros the state spends, where do they go?

Of every hundred euros of final state spending in 2025, according to the budget law, the biggest sector is social spending (pensions, assistance and labor): 23.1 euros.

SectorOf every hundred euros, 2025 (budget law)
Social (pensions, assistance, labor)23.1
Local and regional authorities (transfers to regions and local governments, of which about 89 billion euros for health care)16.2
Interventions in the economy13.6
Interest on the debt11.7
Tax refunds and accounting adjustments11.2
General administration (constitutional bodies, institutional services, economic and financial policies)9.0
Education, universities, culture, research8.4
Defense4.0
Justice and public order2.7
Housing and urban planning0.1

The column adds up to 100, apart from rounding. Source: RGS, OpenBDAP (initial appropriations for 2025).

In 1970 the classification was different: the numbers for the sectors that follow (interest, defense, education) are those of the state budget of the time, and should not be read as the same series.

Within the same series, the budget laws, the social sector goes from 18.5% in 2008 to 23.1% in 2025; local and regional authorities from 21.3% to 16.2%; justice and public order from 3.1% to 2.7%. Here the state’s financing of health care is not in the social sector but in local and regional authorities (88.7 billion euros in 2025, 9.7% of final spending); in the COFOG classification, further down, health is separate.

How much does interest on the debt weigh?

Interest on the debt is the most solid result of the whole analysis, in terms of direction. In 1970 it was 4.3% of state spending; between 1993 and 1996 about 28%, more than one euro in four (RGS, payments, excluding the repayment of loans). As a share of GDP, the value of what Italy produces in a year, it went from 0.8% to the 10.9% of 1993. The highest value of the share, the 30.4% of 1997, falls in a year in which the classification changes: the method note explains why it is not the true peak.
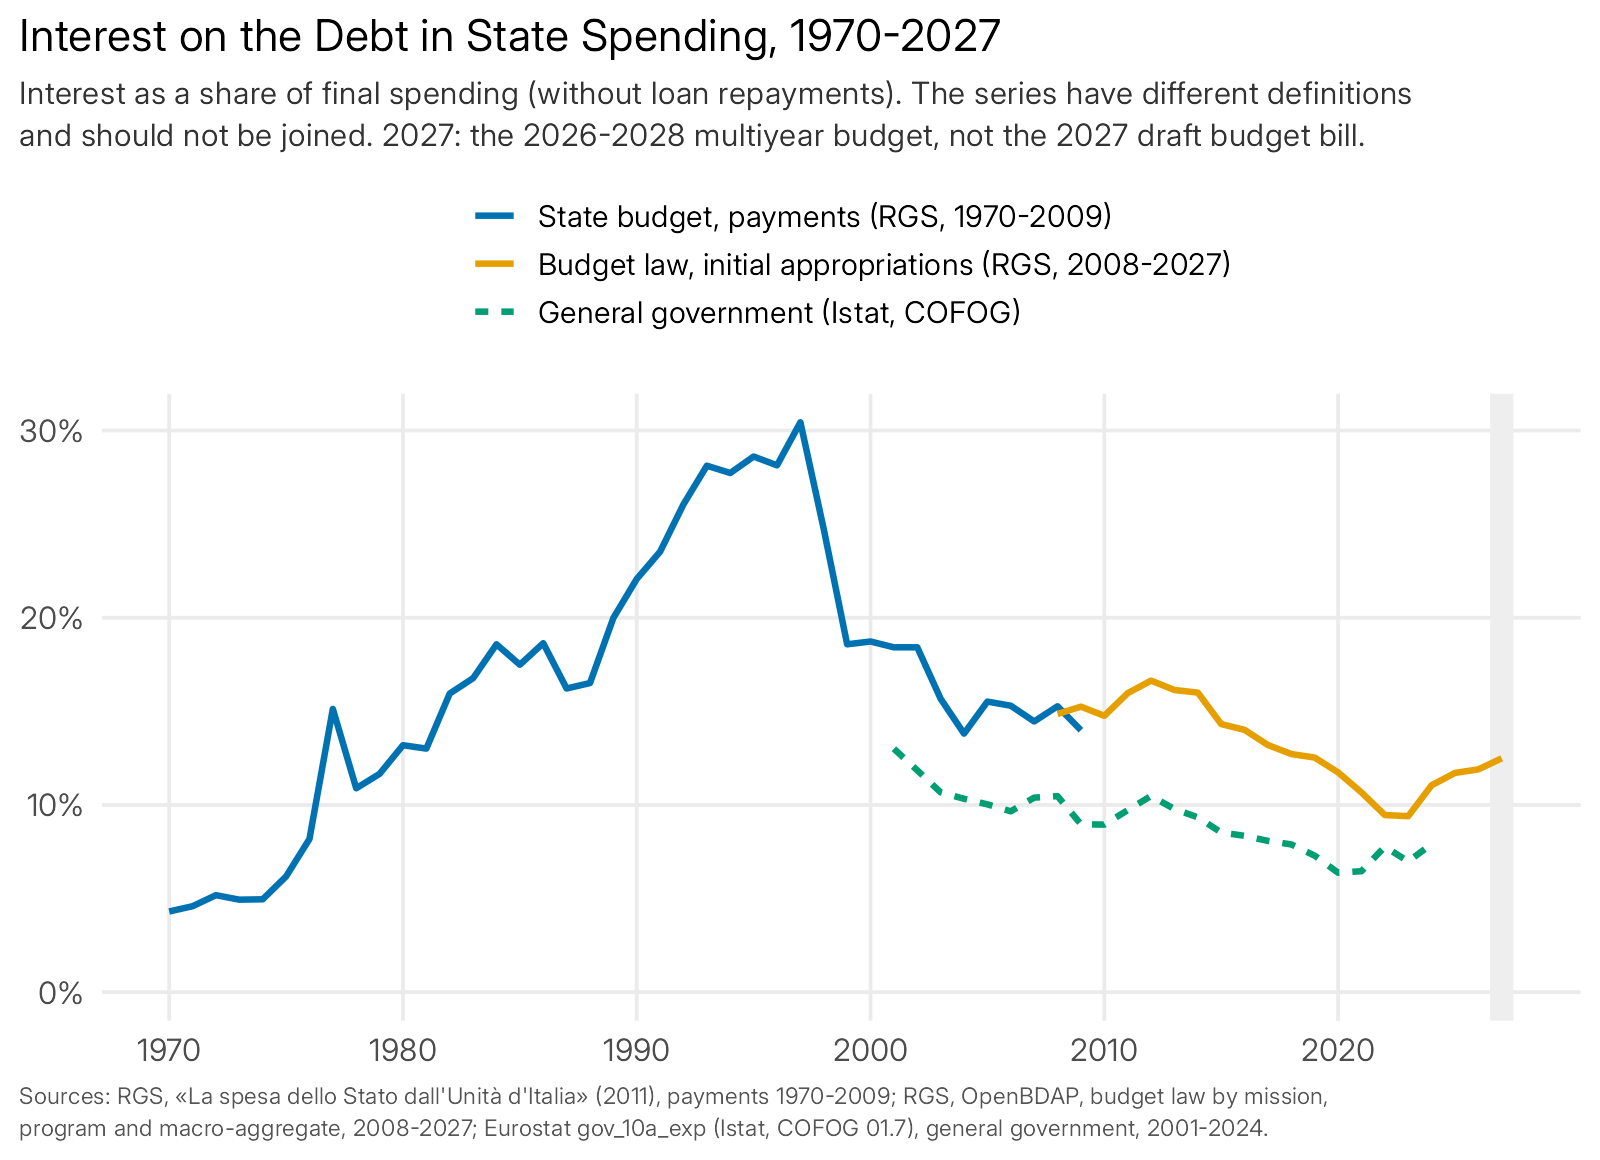
Line chart: interest on the debt, as a share of state spending, rises from 4.3% in 1970 to about 28% in 1993-1996. In the budget laws it falls from 14.9% in 2008 to 9.4% in 2023 and rises again to 12.5% in 2027.
Interest on the debt as a share of final state spending, 1970-2027. The series have different definitions and should not be joined; 2027 is the 2026-2028 multiyear budget. Sources: RGS (2011), RGS OpenBDAP, Eurostat (Istat, COFOG).

In the budget laws the share starts at 14.9% in 2008 and reaches a peak of 16.6% in 2012. Then it falls to a low of 9.4% in 2023 and rises again: 11.7% in 2025 and 12.5% in 2027.

On the debt and on interest I also wrote in “Italy’s Public Debt, Interest and Health Care: A Video’s Numbers, Checked”.

What was happening in those years, according to the sources. The sources document these facts; they do not say how much each one weighs on the share of interest.

  • The 1970s. On October 17, 1973, OAPEC, the organization of the Arab oil-producing countries, decided to cut oil production, the CIA wrote in a memo of October 19: it was the first oil shock. According to the Bank of Italy (Quaderni di Storia Economica), the impact on Italy was “about twice the OECD average” (the OECD is the organization of the most industrialized countries). In those years the state’s deficit was partly financed by the Bank of Italy, which bought the bonds left unsold: a Bank of Italy study (Questioni di economia e finanza) writes, in its abstract, that in the early 1970s budget deficits and the creation of monetary base “were correlated.”
  • 1981-1993. In 1981 the Treasury and the Bank of Italy began the “divorce”: the Bank was no longer obliged to buy the unsold bonds (Bank of Italy, 2011). According to the same source, real interest rates turned positive again, but “the effects of the ‘divorce’ on fiscal policy are not, however, those that were hoped for”; in the Governor’s Concluding Remarks on 1990 (May 31, 1991) we read that “Italy’s net foreign debt and the State’s debt feed a growing expenditure on interest.”
  • After 1993. The fall in nominal interest rates contributed “to a considerable extent” to the reduction of the deficit in the 1990s (Bank of Italy, Annual Report on 1999); in May 1998 Italy was admitted to the euro (decision 98/317/EC). Interest rates are not in this article’s data: the link with the share of interest is a reading, not a measurement.
  • 2011-2012. In the crisis of the spread (the difference in yield between Italian and German government bonds), the Bank of Italy (Annual Report on 2012) records that in 2012 interest spending by general government rose by 10.7%; the 16.6% peak in the budget laws falls in 2012.

What happened to defense?

In state spending, defense is worth:

  • 1970: 10.0%.
  • 1980: 4.1%.
  • From 1980 to 2009: between 3.0% (1999) and 4.9% (2004).
  • Budget laws 2008-2027: between 3.7% and 4.4%.

The two series agree in 2008 and 2009.

The fall as a share of GDP is smaller: from 1.95% to 1.21% between 1970 and 1980. In the 1970s the share falls partly because the rest of spending grows and partly because defense also falls as a share of GDP. For all levels of general government, defense stays between 2.2% and 2.9% of total spending from 1995 on.

Why the share of defense falls between 1973 and 1978, the sources I read do not document.

Was education cut in the 1970s?

The share of education, culture and research in state spending:

  • 1970: 19.8%.
  • 1980: 12.8%.
  • Low: 9.1%, in 1987.

But as a share of GDP, between 1970 and 1980, it stays almost flat: from 3.9% to 3.8%.

So in 1970-1980 it is not a cut: it is the rest of spending that grows. The state’s final spending goes from 19.6% to 29.8% of GDP, and the share of each sector shrinks if the total expands.

In the budget laws the share falls from 10.7% in 2008 to 8.4% in 2025. For all levels of general government, from 1995 to 2024, education goes from 8.5% to 8.0%, with a peak of 9.7% in 2003 and a low of 7.3% in 2022.

In 2008, decree-law 112 (article 64) reduces school staff. The Bank of Italy estimates that “about 70 percent of the reduction in the number of people employed” in the public sector, from the 2006 peak, is due to schools (Annual Report on 2012, based on data from the State General Accounting Office’s annual account up to 2011). The data say that the share falls after 2008, not how much of that fall depends on this decree.

Where does the money of all levels of general government go?

The most solid figures for “where public money goes,” from 1995, come from Istat’s COFOG classification (the international classification of the functions of general government), which covers all levels of general government, not only the state.
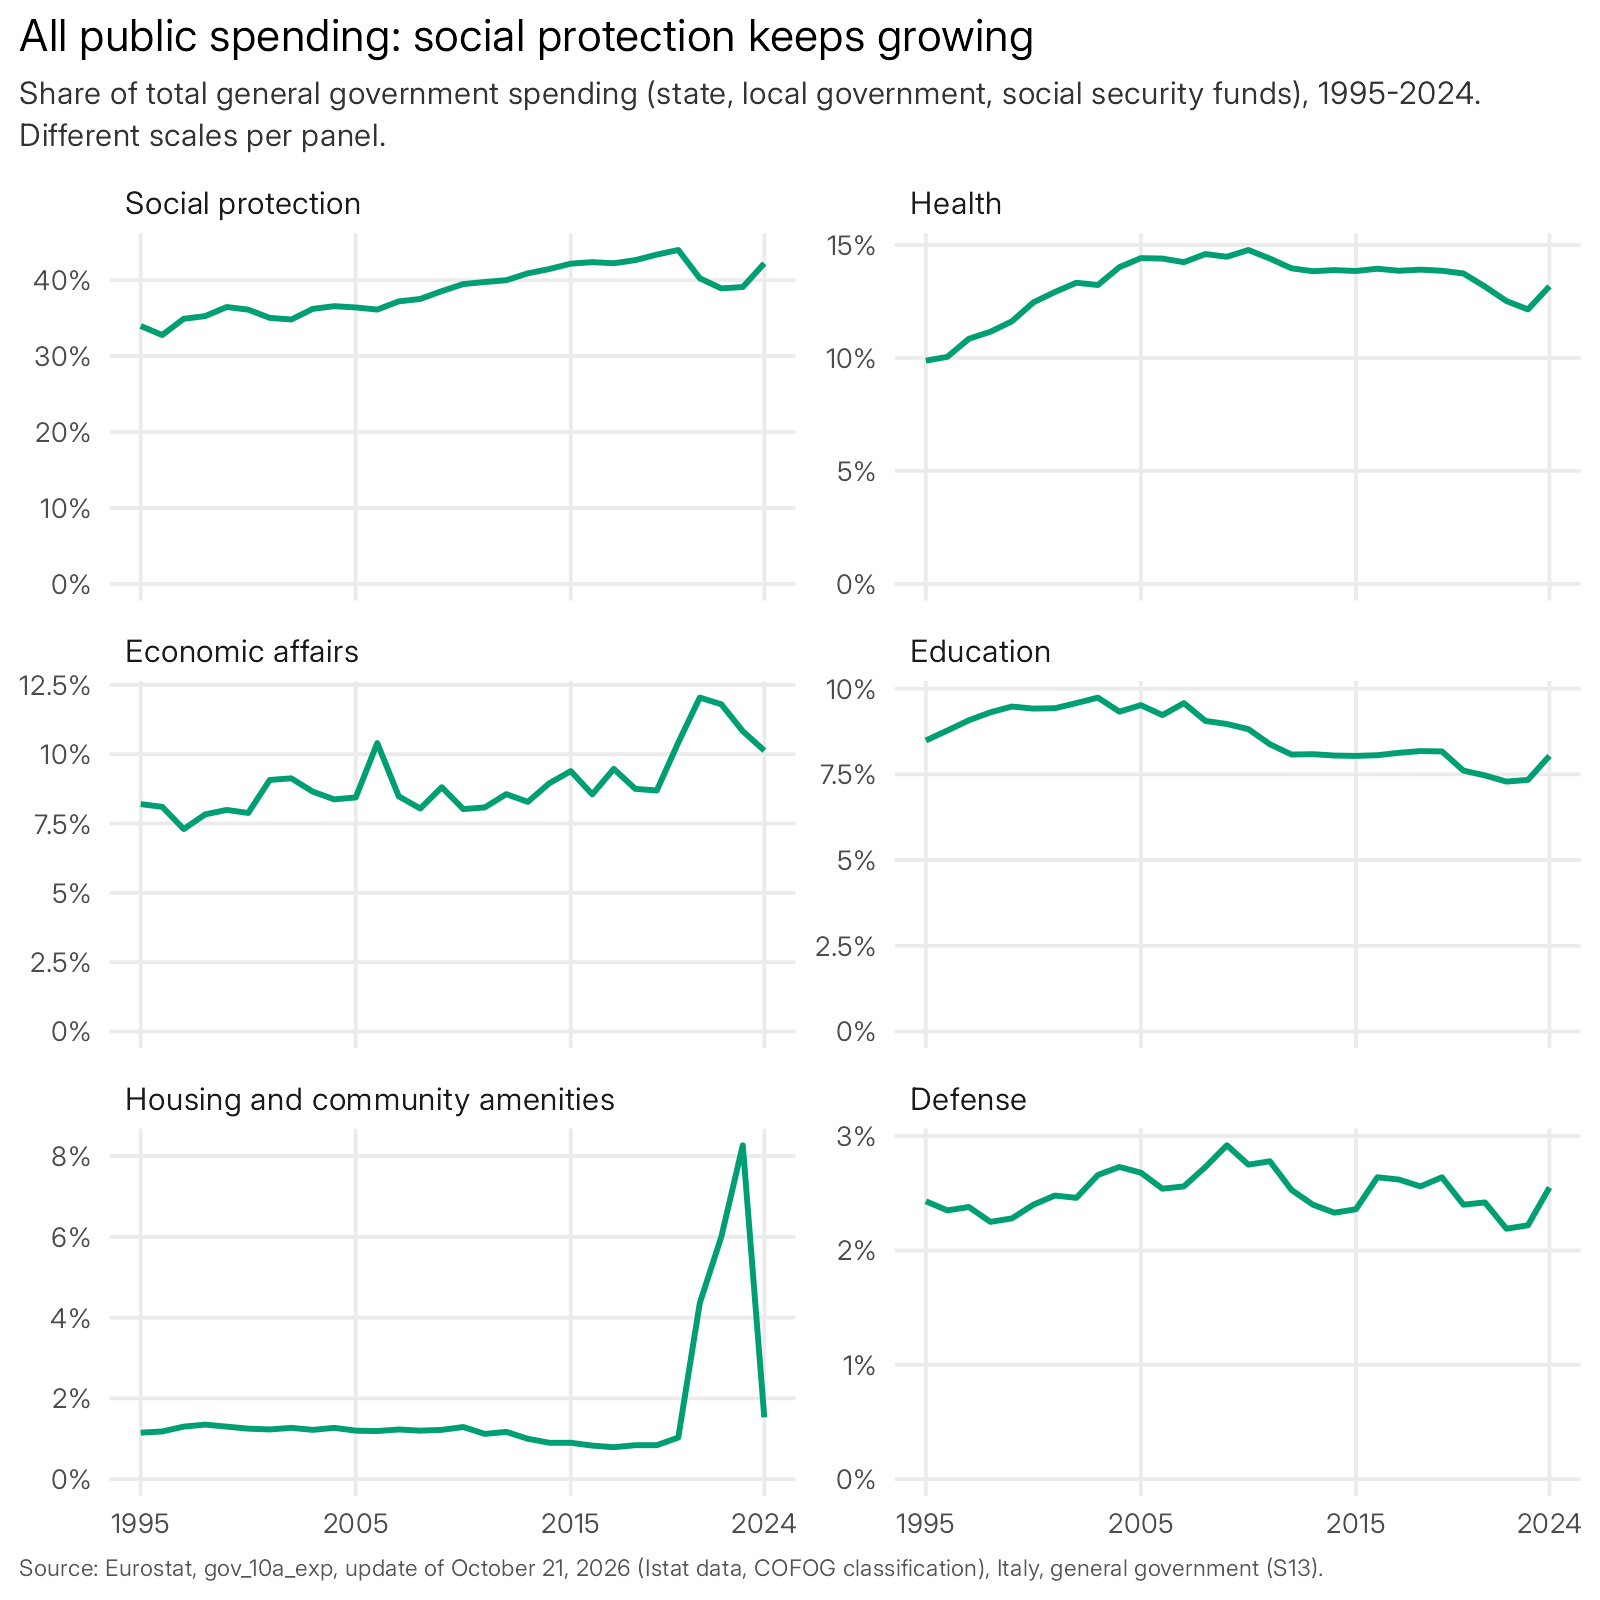
Six line charts: from 1995 to 2024, in the spending of all levels of general government, social protection rises from 34.0% to 42.2%, health from 9.9% to 13.2%, education falls from 8.5% to 8.0%, defense stays between 2.2% and 2.9%.
Share of each function in the total spending of Italian general government, 1995-2024. Different scales for each panel. Source: Eurostat, gov_10a_exp, update of October 21, 2026 (Istat data, COFOG classification), Italy, general government (S13).
  • Social protection (pensions, unemployment, family support and assistance): from 34.0% of spending in 1995 to 42.2% in 2024, with a peak of 44.0% in 2020.
  • Health: from 9.9% in 1995 to a peak of 14.8% in 2010; then it falls to 12.2% in 2023 and in 2024 it is at 13.2%.
  • Education: from 8.5% in 1995 to a peak of 9.7% in 2003, then to 7.3% in 2022 and to 8.0% in 2024.
  • Defense: between 2.2% and 2.9%.
  • Housing and community amenities: a peak of 8.3% in 2023, against 1.0% in 2020 and 1.5% in 2024. The data do not say why.

The shares always add up to 100: in the years when housing rises to 8.3% the other functions weigh less, and in 2024, when housing returns to 1.5%, they rise again.

What do budget laws not tell?

The budget law is the spending program at the start of the year; crises decided during the year are not in it. In 2020, the year of the pandemic, the share of interventions in the economy rises by 11.6 percentage points between the budget law and the revised appropriations, that is, the amounts after changes made during the year: the initial budget law does not contain the spending decided during the year.

Two other things are not obvious. In the budget laws one euro in nine is a tax refund or an accounting adjustment: 102.6 billion euros in 2025, 11.2% of final spending, in the program “Regolazioni contabili, restituzioni e rimborsi d’imposte” (“accounting adjustments, restitutions and tax refunds”; a program is a spending item within a mission).

They are not spending for a sector, and if they stay in “general administration,” that sector looks much bigger than it is: that is why I keep them separate.

The program that has grown the most is called “interventi di sostegno tramite il sistema della fiscalità” (“support interventions through the tax system”): from 18.4 billion euros in 2019 to 61.4 in 2025. What it contains is not verified here.

It is the main part of the increase in interventions in the economy in the budget laws: from 5.2% of spending in 2008 to 13.6% in 2025, that is, 96 billion euros more, of which 61 in this program. In the multiyear budget the share returns to 11.6% in 2027.

What do the numbers say, taken together?

Lined up, the data say things that headlines about “cuts” and “waste” leave separate:

  1. The most marked change among those that can be read is that of interest: from 4.3% (1970) to about 28% (1993-1996) of state spending. In the budget laws, from 2008, it goes from a peak of 16.6% (2012) to a low of 9.4% (2023), then rises again.
  2. A share that falls is not always a cut: in the 1970s education loses share but as a share of GDP stays flat, and defense loses share and as a share of GDP falls less than the share.
  3. For all levels of general government the biggest weight is social protection: 42.2% of spending in 2024, rising since 1995.
  4. Budget laws are not all of spending: crises decided during the year, like 2020, are not in them.

What can’t the numbers say?

Two limits, to keep in mind.

  • The three series. They are not joined: the first measures payments, the second initial appropriations, the third the spending of all levels of general government. Levels before and after 2008 are not compared, and 2027 is the second year of the multiyear budget, not the draft budget bill.
  • The reasons. A number says how much, not why. The historical facts mentioned are those the sources document; for defense, for 2014-2027 and for the abrupt changes of 1993, 1997 and 2001, which are probably items that changed category, here I give no reasons.

All that remains is to see whether the breakdown by sector of the 2027 draft budget bill, presented to the Chamber of Deputies on October 30, 2026 (A.C. 3174), will follow that of the multiyear budget already approved.

Frequently asked questions

Why are the data in percentages and not in euros?

Because until 2001 the accounts were in lire. The official series convert them into euros at the fixed rate of 1,936.27 lire to the euro: the unit changes, not the purchasing power. Percentages say, of every hundred euros the state spends in a year, how many go to each sector, and they do not depend on the currency.

What is interest on the debt?

It is what the state pays every year to those who lent money by buying its bonds. In 1970 it was 4.3% of state spending and between 1993 and 1996 about 28% (payments, RGS); in the multiyear budget, 2027 is at 12.5%.

Has defense spending fallen?

Yes, as a share: from 10.0% of state spending in 1970 to 4.1% in 1980, then between 3.0% and 4.9%. As a share of GDP the fall is smaller, from 1.95% to 1.21% between 1970 and 1980. In the 1970s the share falls partly because the rest of spending grows and partly because defense also falls as a share of GDP.

Where does the money of all levels of general government go in 2024?

In 2024, according to Istat, 42.2% of total spending goes to social protection (pensions, unemployment, family support and assistance), 13.2% to health, 8.0% to education and 2.6% to defense. These are shares of the spending of the state, regions, municipalities and social security institutions together.

Why isn’t there a single series from 1970 to 2027?

Because the official sources change and measure different things: state payments through 2009, initial appropriations of the budget laws from 2008. In 2008 and 2009 they overlap with different levels: trends within each series are compared, not levels between series.

Is 2027 the draft budget bill?

No: the 2027 data are those of the 2026-2028 multiyear budget, already approved. The draft bill for 2027, the government’s proposal that Parliament must approve, is not among the data used.

Download the data and the code

I have gathered in a zip file the tables and the code with which I redid the calculations, so that anyone who wants to can repeat the analyses. Inside are the processed tables in CSV files, that is, plain-text tables (the three series, the comparison between the series and between initial and revised appropriations), the scripts that redo the calculations and draw the three charts, written in R, a language for data analysis, a file of instructions and the list of downloaded files, with address, date and fingerprint. The original data from RGS, Eurostat and AMECO are not in the file: they can be downloaded from the sites listed in the sources. Download the data and the code for the analysis (zip): 46,779 bytes, November 4, 2026, SHA-256 707b8630fa595b8e84cada0333b8287a84cf35a3cb5a596e7a51eef6a2302cf4.

Method note (for those who want to check the math)

The shares for the state (1970-2009 and 2008-2027) are calculated on final spending, that is, the total without the repayment of loans. For the budget laws I grouped the missions into sectors: for example, defense includes defense and civil rescue, as the RGS did with civil protection; tax refunds and accounting adjustments and the financial relations with local and regional authorities are sectors of their own; interest is macro-aggregate 7 “oneri del debito pubblico” (“public debt charges”) in any mission. The share of GDP uses AMECO’s nominal GDP, with the same conversion of the lire; for 2026 and 2027 there is none, because GDP is only forecast.

I checked the series against one another. For interest, defense, education, justice and social spending, the changes in 1995-2009 (for interest, 2001-2009) in the payments series and those in the COFOG data for central government go in the same direction (correlations of the levels between 0.56 and 0.90); for interventions in the economy they do not, and that is why I do not discuss them. Initial and revised appropriations in the 2008-2025 budget laws differ by less than one point on average, with the exception of 2020 (11.6 percentage points in interventions in the economy).

In 1997, interest in euros falls from 103.1 to 98.9 billion and as a share of GDP from 9.8% to 9.0%, while its share rises from 28.1% to 30.4%, because the final spending on which it is calculated falls from 366 to 325 billion (from 35.0% to 29.7% of GDP) and rises again in 1998-1999.

The 2027 draft budget bill (A.C. 3174, the text the government presented to the Chamber of Deputies) is not in the data: 2027 is the second year of the 2026-2028 multiyear budget. On the 2027 budget package and on energy I wrote in “Italy’s budget and energy: where the MASE’s €14 billion comes from”.

In the payments series the classification changes in 1998, and in some years (1993, 1997, 2001) there are jumps in opposite directions, probably items that changed category and not spending that changed (for 2001, from 2001 the health care of the ordinary-statute regions is no longer financed with transfers from the state: legislative decree 56/2000): that is why I do not discuss them and draw no conclusion on the weight of interventions in the economy before 2009.

In the COFOG series, interest on the debt is separated only from 2001, and 2025 has not yet been published by Eurostat.

On housing: Istat, in its press release of March 1, 2023, writes that, after further examination with Eurostat, the tax credits of the Superbonus and of the Bonus facciate (the facade bonus) are classified as “payable” (credits that, with reasonable certainty, will be used in full over time) and recorded as expenditure for the full amount, from 2020; whether the housing peak depends on this, the COFOG data do not say.

The data were downloaded on November 4, 2026. The R code and the tables are in the zip file attached to this article; the original files can be downloaded again from the sources with the 00_scarica_fonti.R script, which is in the zip.

Sources

Accessed November 4, 2026. I mark the type of each source: primary (whoever produces the data), derived (calculated from primary data), secondary. Titles of Italian sources are in the original, with an English translation in brackets. Quotations from Italian-language sources are my translations.

  1. RGS, State General Accounting Office (Ragioneria generale dello Stato), La spesa dello Stato dall’Unità d’Italia [“State spending since Italian unification”] (2011), database DB_e_Tavole_1862_2009.xls, payments of the state budget by functional category, 1970-2009. Primary; derived from primary data.
  2. RGS, OpenBDAP, Legge di Bilancio Pubblicata – Serie storica – Spese per Missione Programma Macroaggregato [“Published Budget Law – Historical series – Spending by Mission, Program, Macro-aggregate”], 2008-2027 (CC BY license). Primary; derived from primary data.
  3. Eurostat, gov_10a_exp (Istat data), spending of general government by function (COFOG), Italy, 1995-2024, update of October 21, 2026. Primary.
  4. European Commission, AMECO, nominal GDP and balances (with the conversion of the lire at 1,936.27 per euro). Primary.
  5. Bank of Italy, L’autonomia della politica monetaria [“The autonomy of monetary policy”], address of February 15, 2011. Primary (for the Bank’s assessments). https://www.bancaditalia.it/pubblicazioni/interventi-governatore/integov2011/AREL_150211.pdf
  6. Bank of Italy, Considerazioni finali del Governatore sul 1990 [“Governor’s Concluding Remarks on 1990”], May 31, 1991. Primary. https://www.bancaditalia.it/pubblicazioni/interventi-governatore/integov1991/CIAMPI_310591.pdf
  7. Bank of Italy, Relazione annuale sul 1999 [“Annual Report on 1999”] (assembly of May 31, 2000), Concluding Remarks. Primary. https://www.bancaditalia.it/pubblicazioni/relazione-annuale/1999/rel99_pubb_completa.pdf
  8. Bank of Italy, Relazione annuale sul 2012 [“Annual Report on 2012”], May 31, 2013. Primary. https://www.bancaditalia.it/pubblicazioni/relazione-annuale/2012/rel_2012.pdf
  9. Bank of Italy, “Monetary policy and fiscal dominance in Italy from the early 1970s to the adoption of the euro: a review,” Questioni di economia e finanza no. 141, Gaiotti and Secchi, November 2012. Primary. https://www.bancaditalia.it/pubblicazioni/qef/2012-0141/QEF_141.pdf
  10. Bank of Italy, L’Italia e la crisi della golden age. La politica monetaria italiana dalla metà degli anni Sessanta alla vigilia dello SME (1965-1978) [“Italy and the crisis of the golden age. Italian monetary policy from the mid-1960s to the eve of the EMS (1965-1978)”], Quaderni di Storia Economica no. 55, Gelsomino, July 2025. Primary. https://www.bancaditalia.it/pubblicazioni/quaderni-storia/2025-0055/QSE-55.pdf
  11. Office of the Historian (U.S. Department of State), FRUS 1969-76, vol. XXXVI, doc. 223, CIA memo of October 19, 1973. Primary. https://history.state.gov/historicaldocuments/frus1969-76v36/d223
  12. Normattiva, decree-law of June 25, 2008, no. 112, Disposizioni urgenti per lo sviluppo economico, la semplificazione, la competitività, la stabilizzazione della finanza pubblica e la perequazione tributaria [“Urgent provisions for economic development, simplification, competitiveness, the stabilization of public finances and tax equalization”], converted by law of August 6, 2008, no. 133; art. 64, Disposizioni in materia di organizzazione scolastica [“Provisions on school organization”]. Primary. https://www.normattiva.it/uri-res/N2Ls?urn:nir:stato:decreto.legge:2008-06-25;112~art64
  13. Istat, PIL e indebitamento AP. Anni 2020-2022: prodotto interno lordo, indebitamento netto e saldo primario delle Amministrazioni pubbliche [“GDP and general government net borrowing. Years 2020-2022: gross domestic product, net borrowing and primary balance of general government”], press release of March 1, 2023 (with a section on the treatment of the Superbonus and the Bonus facciate). Primary. https://www.istat.it/it/files/2023/03/PIL-e-indebitamento-AP.pdf
  14. Council of the European Union, “Council Decision of 3 May 1998 in accordance with Article 109j(4) of the Treaty (98/317/EC)” (Italian text: Decisione del Consiglio del 3 maggio 1998 a norma dell’articolo 109 J, paragrafo 4 del trattato), meeting in the composition of Heads of State or Government, OJ L 139 of May 11, 1998, pp. 30-35 (article 1 says that Italy, with ten other states, meets the conditions for the adoption of the single currency on January 1, 1999). Primary. https://publications.europa.eu/resource/celex/31998D0317
  15. Chamber of Deputies, page for A.C. 3174, Bilancio di previsione dello Stato per l’anno finanziario 2027 e bilancio pluriennale per il triennio 2027-2029 [“State budget forecast for the 2027 fiscal year and multiyear budget for the 2027-2029 three-year period”], presented October 30, 2026. Primary. https://www.camera.it/leg19/126?tab=&leg=19&idDocumento=3174&sede=&tipo=
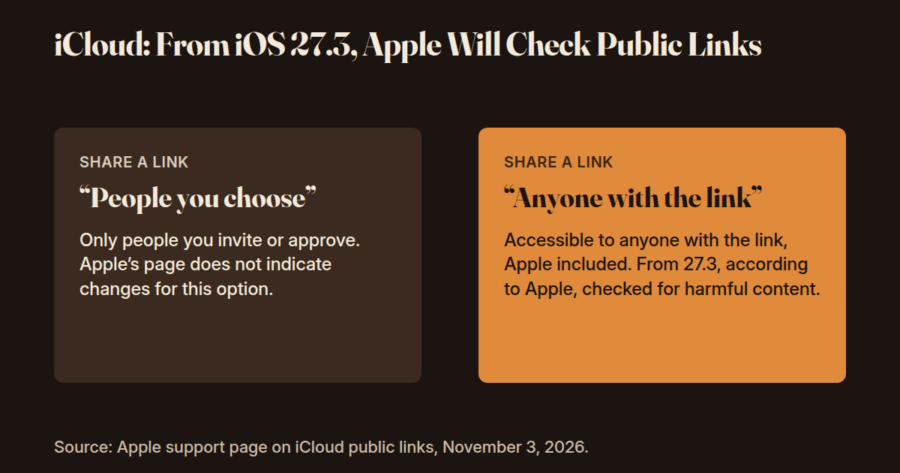
Two boxes on sharing iCloud links. “People you choose”: only people you invite or approve, with no changes indicated by Apple. “Anyone with the link”: accessible to Apple too, which checks it for harmful content from 27.3.

iCloud: From iOS 27.3, Apple Will Check Public Links — What Changes for Photos and Files

Starting with iOS 27.3, will Apple check the photos and files we keep on iCloud?

To find out, I read Apple’s support page on iCloud public links, published on November 3, 2026, and three articles from November 4, 2026, in six steps: from what Apple writes to what no source explains yet.

What does Apple write?

According to Apple’s support page, starting with version 27.3 of its operating systems (iOS, iPadOS, macOS and visionOS, that is, the ones for iPhone, iPad, Mac and Vision Pro), iCloud items shared with a public link will be “checked by Apple for harmful content.” That is the option called “Anyone with the link.” The page does not mention the rest of iCloud.

The page opens by saying that an item shared with that option “is made accessible to Apple to check for harmful content.” The examples are a photo in iCloud Photos and a file in iCloud Drive.

What is the difference between “People you choose” and a public link?

According to the page, when you share an iCloud item you can choose “Share a Link” or “Send a Copy.” With a link, there are two options:

  • “People you choose”: only the people you invite or approve.
  • “Anyone with the link”: the item is accessible to anyone who has the link, Apple included.

The new rule, according to Apple, concerns the second option; for the first, the page indicates no changes.

What does “no longer end-to-end encrypted” mean?

End-to-end encryption, according to Apple, is the protection under which data can be read only on your own trusted devices, where you are signed in with your Apple Account: no one else, not even Apple, can access it. Advanced Data Protection is an optional setting that extends this protection to more iCloud data, including photos, notes and backups.

For an item shared with a public link, the November 3 page says it is no longer end-to-end encrypted, even with Advanced Data Protection turned on.

But it is not new that this option makes the item accessible to anyone who has the link, Apple included: 9to5Mac writes so. What changes is that Apple says it will begin checking those links.

An Apple page from January 5, 2026 also lists content shared with a public link among the content without Advanced Data Protection.

What happens if Apple considers content harmful?

According to the page, anyone who tries to upload harmful content exposes the item to action: Apple reserves the right to move, refuse, modify, remove or delete it at any time. Apple may also act on the Apple Account: block or disable it; prevent the creation of a new account with the same email address or phone number; “if necessary,” involve law enforcement.

What do the news outlets say?

  • What “harmful content” means. Apple does not define it. MacRumors writes that it could be malware (harmful software), malicious files or child sexual abuse material (CSAM), given that Apple mentions law enforcement. The Register suggests that it may also include other “potentially unlawful” content. These are the outlets’ hypotheses: Apple’s page names neither malware nor child sexual abuse material.
  • How the check works. The Register writes that Apple has not explained how the checks will work and did not answer its questions. Apple writes “check” and “checked”; the verb “scanned” appears in The Register’s subhead, not on Apple’s page.
  • Links already created. MacRumors writes that Apple does not say whether links created before the 27.3 updates will be checked.
  • When it ships. 9to5Mac writes that the first beta of iOS 27.3 (a test version for developers, ahead of the public one) came out this week; according to The Register, on Tuesday. The Register and MacRumors give December for the public version, without citing a source. Apple’s page gives no dates and does not say whether the check already applies in the beta.

What do the sources not say yet?

  • Italy and the European Union. The page only writes that not all features are available in all countries or regions.
  • How the check works and where (on the device or on Apple’s servers): the page does not say; it writes that the item “is made accessible to Apple.”
  • “Send a Copy.” The page does not name it among the items that are checked.

To the question that opens this article the sources answer like this: Apple writes that items shared with a public link will be checked. MacRumors and The Register read the rule the same way: it concerns only public links, not content shared directly with other people.

All that remains is to see, when the final version ships, whether Apple will explain how the checks work and for which countries.

Frequently asked questions

Will Apple check everything I have on iCloud?

According to Apple’s support page, the check concerns items shared with a public link (“Anyone with the link”). MacRumors and The Register read the rule the same way: it concerns only public links, not content shared directly with other people. Apple’s page does not mention the rest of iCloud.

What changes if I share with “People you choose”?

The new rule, according to Apple, applies to sharing with a public link. For “People you choose,” that is, only the people you invite or approve, the page indicates no changes. The page does not name “Send a Copy,” sending a copy, among the items that are checked.

What is end-to-end encryption?

According to Apple, it is the protection under which data can be read only on the owner’s trusted devices, not by Apple. For an item shared with a public link, Apple writes that it is no longer end-to-end encrypted, even with Advanced Data Protection turned on.

What is Advanced Data Protection?

According to Apple it is an optional setting that makes more iCloud data, including photos and backups, end-to-end encrypted. For a public link, according to Apple, the item is not end-to-end encrypted even if Advanced Data Protection is turned on.

Will the links I have already created be checked?

Apple’s page does not say. MacRumors notes that it does not clarify whether links created before the 27.3 updates will be checked. The Register also writes that Apple has not explained how the checks will work, or whether they will be carried out by people, automated systems or both.

Does it apply in Italy too?

Apple’s page names neither Italy nor the European Union. It only writes that not all features are available in all countries or regions. When the final version ships, we will see whether Apple explains for which countries it applies.

Method note (for those who want to check)

I read Apple’s pages and the three articles on November 5, 2026. The quotations in the text are in the original English; for the passages reported in paraphrase, these are the originals.

  • Apple Support, page of November 3, 2026: “checked by Apple for harmful content”; “is made accessible to Apple to check for harmful content”; “Share a Link” / “Send a Copy”; “People you choose” (“only people you invite or approve”); “Anyone with the link” (“including Apple”); “the item is no longer end-to-end encrypted, even if the owner or participants have turned on Advanced Data Protection”; “If you try to upload harmful content, Apple reserves the right to move, refuse, modify, remove, or delete the content at any time”; “blocking the ability to create a new Apple Account with the associated email address or phone number”; “if necessary”; “Not all features are available in all countries or regions”.
  • Apple Support, “iCloud data security overview,” January 5, 2026: “can be decrypted only on your trusted devices where you’re signed in to your Apple Account”; “No one else can access your end-to-end encrypted data — not even Apple”; “an optional setting that offers our highest level of cloud data security”; with Advanced Data Protection the number of end-to-end encrypted categories “rises to 25 and includes your iCloud Backup, Photos, Notes, and more”; content shared with “anyone with the link” does not support Advanced Data Protection.
  • 9to5Mac: the option “has always made it accessible to anyone who has the link, including Apple”; “Apple says it will begin checking those public links for harmful content”; the first beta “this week”.
  • MacRumors: “malware, malicious files, and/or child sexual abuse material (CSAM)”; “given Apple’s mention of law enforcement involvement”; “it’s only the latter option that will be evaluated by Apple”; “Apple does not say whether links created before the 27.3 updates will be checked”.
  • The Register: “hasn’t explained how the checks will work”; “whether human moderators, automated systems, or both”; subhead: “Content shared with anyone who has the URL will be scanned for ‘harmful content’”; “potentially unlawful”; “applies only to iCloud content shared via links created to be accessible to anyone, as opposed to content shared directly with other people”; the beta “on Tuesday” (the calendar gives November 3, 2026); the public version “expected in December”.

The dates of the outlets are the ones printed on the pages: The Register November 4, 2026, 21:49 UTC; 9to5Mac November 4, 2026, 7:55 a.m. PT; MacRumors November 4, 2026, 11:12 a.m. PST. The release notes of the iOS 27.3 beta are not among the sources read.

Sources

Accessed on November 5, 2026. I mark the type of each source: primary (whoever writes the rule), secondary.

  1. Apple Support, “Learn more about sharing content that can be accessed by Anyone with the Link,” “Published Date: November 03, 2026.” Primary. https://support.apple.com/en-us/149168
  2. Apple Support, “iCloud data security overview,” “Published Date: January 05, 2026.” Primary. https://support.apple.com/en-us/102651
  3. Apple Support, “How to turn on Advanced Data Protection for iCloud,” “Published Date: April 17, 2026.” Primary. https://support.apple.com/en-us/108756
  4. The Register, Brandon Vigliarolo, “Apple turns iCloud into spy cloud, will start looking at public share links,” November 4, 2026. Secondary (draws on Apple’s page, with its own comments; the headline is the outlet’s judgment). https://www.theregister.com/security/2026/11/04/apple-turns-icloud-into-spy-cloud-will-start-looking-at-public-share-links/5307681
  5. 9to5Mac, Ryan Christoffel, “With iOS 27.3, Apple will start checking iCloud public links for ‘harmful content,’” November 4, 2026. Secondary. https://9to5mac.com/2026/11/04/with-ios-27-3-apple-will-start-checking-icloud-public-links-for-harmful-content/
  6. MacRumors, Juli Clover, “Apple Will Check Public iCloud Links for Harmful Content Starting in iOS 27.3,” November 4, 2026. Secondary. https://www.macrumors.com/2026/11/04/ios-27-3-icloud-link-check/
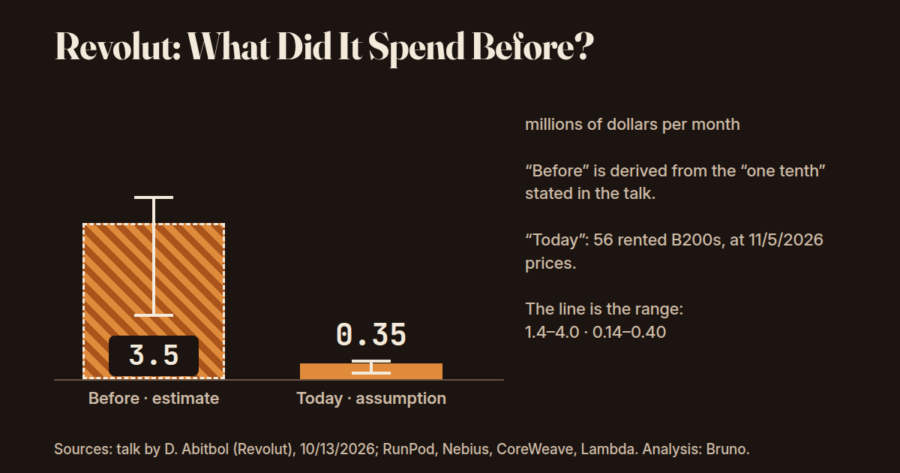
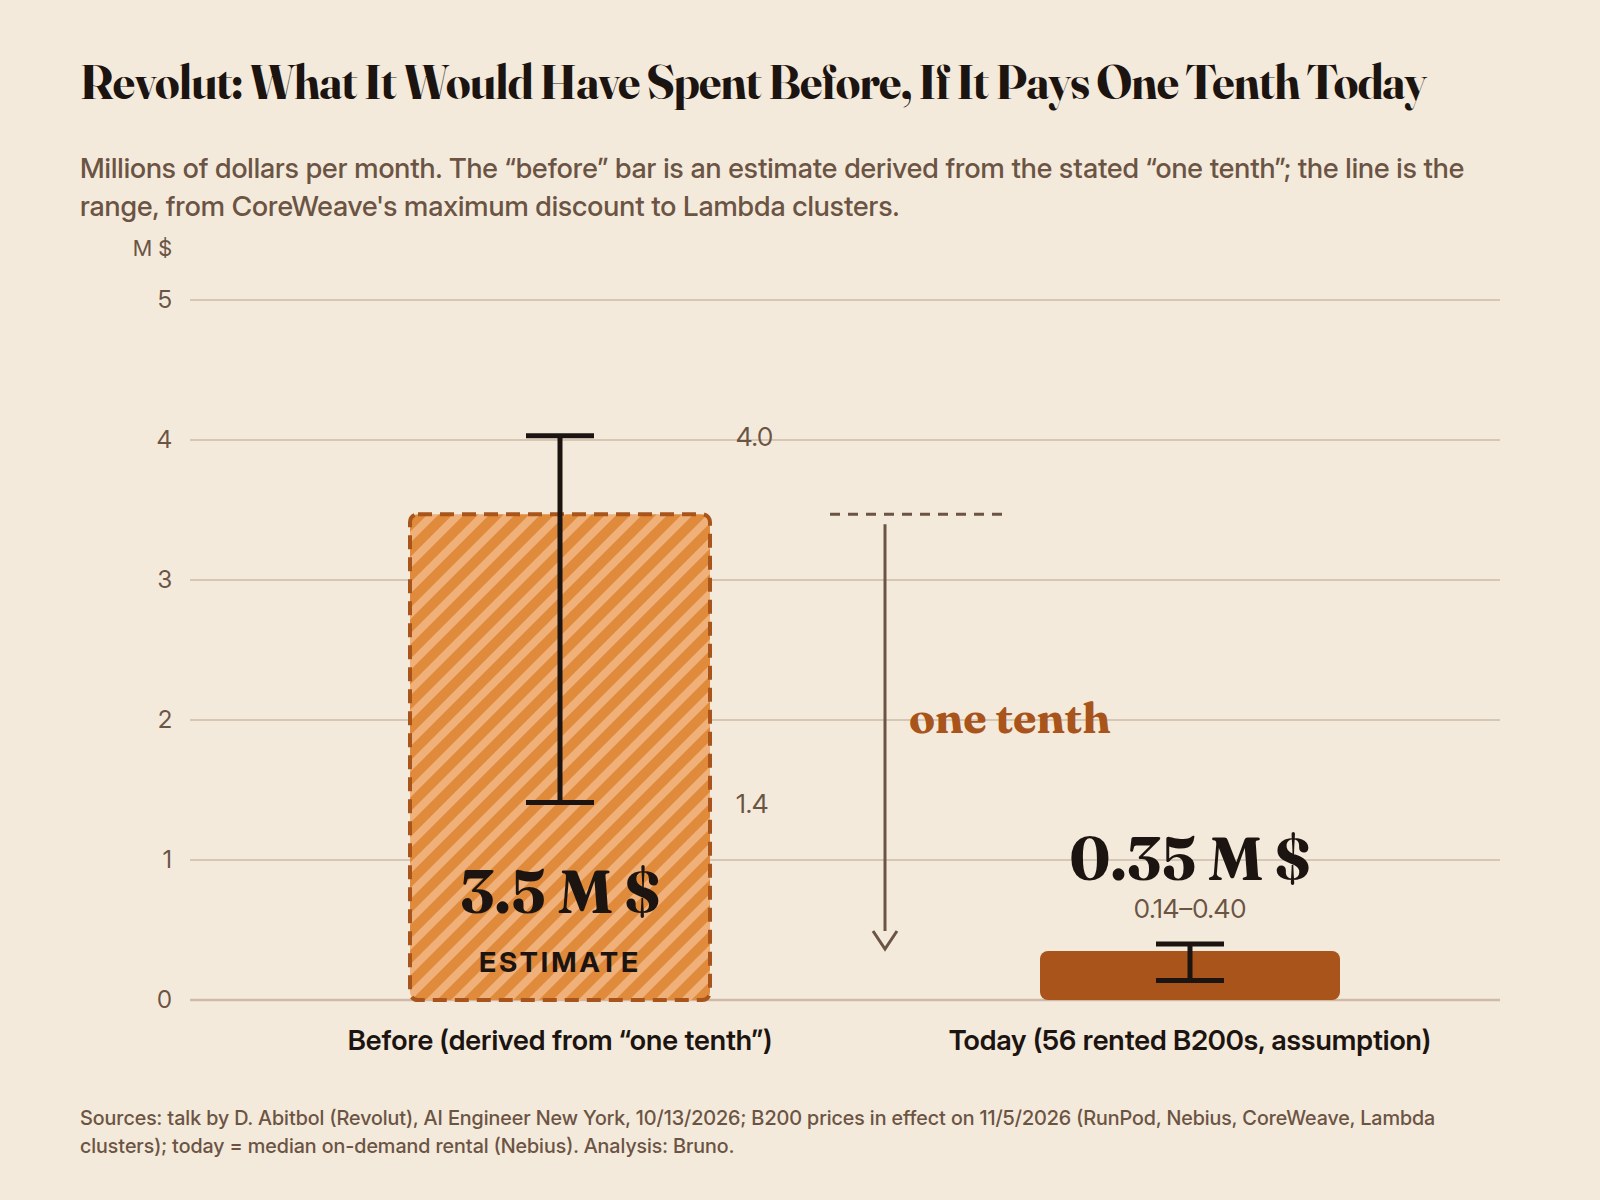
Two bars on Revolut's monthly spend on AI that writes code: before, an estimate from the stated “one tenth,” about 3.5 million dollars (between 1.4 and 4.0); today, an assumption with 56 rented B200 GPUs, about 0.35 million (between 0.14 and 0.40).

Let’s Do the Math on Revolut: What Does a Chinese AI Model Cost to Run In-House, and Would It Be Worth It for Us Too?

How much does it cost to run an artificial intelligence model like GLM in-house for 2,000 engineers, and would it be worth it for us too?

To answer, I started from what David Abitbol, of Revolut, said at AI Engineer in New York (a conference on artificial intelligence) on October 13, 2026. I redid the math with the list prices of November 5, 2026, in six steps: from what Abitbol said, to Revolut’s numbers, to what a small team would need.

“We” here means a company with a small team of developers. “In-house” means not with an API (the paid service for using a model on the maker’s servers), but on compute cards chosen by the company: in the calculations, rented. Anthropic and OpenAI are the companies behind Claude and ChatGPT; GLM is an artificial intelligence model from the Chinese company Z.ai, which Revolut uses so that its engineers can write programs.

Abitbol’s quotations are taken from the talk’s automatic transcript, which can contain errors; the timestamps are in the methodology note.

What did Abitbol say?

Revolut is a European digital bank. Abitbol, who says in the talk that he leads the company’s AI operations, says that around April 2026 Revolut began to self-host, on dedicated GPUs, an “open” model, meaning one with downloadable weights: the weights are the numbers that make up its “knowledge” after training. It is GLM, now in version 5.3, used to write code.

The figures he gives, from the stage:

  • “to serve 2,000 engineers, we roughly need 56 B200”: 56 compute cards (GPUs, made by Nvidia, used to run AI) of the B200 type;
  • an average cost of 30 cents per million tokens (the conference page says $0.30); a token is a piece of text, a word or part of a word, that the model reads or writes;
  • “our invoice is one-tenth of what we were spending on Anthropic and OpenAI”;
  • requests per second going from about 3 in April to more than 7 in August, with the same number of GPUs according to the conference page (in the transcript the sentence is not clear).

These are figures declared by the company, not verified by anyone else. Abitbol also says that Claude Code and Codex, the AI assistants from Anthropic and OpenAI that write programs together with engineers, stay in use “as exception” (for Claude Code this is a probable reading: the automatic transcript has “code code”).

How much do 56 cards cost, and how many tokens are needed?

In short: from $141,000 to $403,000 a month for 56 cards, depending on the contract; the calculations are consistent with what Abitbol says, but they do not prove it.

The first calculation: what 56 B200s cost to rent. Billed by the hour, that is, with no commitment, the prices published on November 5, 2026 by the companies that rent out compute cards run from $7.99 an hour per card (RunPod) to $8.60 (CoreWeave): at 730 hours a month, from $327,000 to $352,000 for 56 cards.

They are not a ceiling: they are below Lambda’s clusters (groups of cards for rent: from $9.36 to $9.86 an hour, from about $383,000 to $403,000 a month) and above the price with the discount of up to 60% that CoreWeave says it offers for committed use, under a term contract (about $141,000 a month). The prices Revolut pays are not known.

The second calculation: how many tokens are needed. The tokens are derived from the assumed cost, so they neither confirm nor refute Abitbol. First assumption: the 30 cents are the cost divided by all the tokens served, cache included (that is, text already read, which the service remembers and rereads at a reduced price). Abitbol says “blended cost of token” and does not explain how he counts it. Second assumption: today’s invoice is only the rental of the 56 GPUs. At hourly prices the cards must serve about 1.1 trillion tokens a month: with 7 requests per second, day and night, about 60,000 tokens per request.

How much did they spend before, and why isn’t it only a matter of prices?

In short: if today’s invoice is one-tenth, before that Revolut was spending about $3.5 million a month (estimate); with 90% cache and today’s API prices, the “one-tenth” is not explained by prices alone.

If today’s invoice is one-tenth (assumption: only the rental of the 56 GPUs), before that Revolut was spending about $3.5 million a month on the AI that writes code, about $1,700 per engineer. It is an estimate, not a figure: the range goes from 1.4 to 4.0 million depending on the price of the GPUs (from 1.2 to 5.0 if “one-tenth” is rounded, between 8% and 12%). Abitbol says that some engineers were spending “a thousand a month, 10,000 a month” (currency not stated).

Two bars on Revolut's monthly spend on AI that writes code: before, an estimate from the stated “one tenth,” about 3.5 million dollars (between 1.4 and 4.0); today, an assumption with 56 rented B200 GPUs, about 0.35 million (between 0.14 and 0.40).
Chart 1. “Revolut: What It Would Have Spent Before, If It Pays One Tenth Today”: about $3.5 million a month (from 1.4 to 4.0) against about 0.35 today (assumption); the “before” bar is derived from the “one-tenth” declared by Abitbol.

The comparison with the APIs is made with the same number of tokens and at today’s list prices, with 2-10% output tokens (the part written by the model) and the cache. The 90% cache is the threshold that Abitbol gives his listeners for a server of their own (according to the automatic transcript, which is unclear), not Revolut’s share; hence the two scenarios.

How many times the $0.30 the APIs would cost for the same number of tokens, at the list prices of November 5, 2026:

ModelCache at 50%: times the $0.30Cache at 90%: times the $0.30
GLM-5.3 served by Z.ai3.0 to 4.01.5 to 2.6
Claude Sonnet 5.54.1 to 6.51.6 to 4.2
gpt-5.3-codex4.1 to 7.62.0 to 5.7
Claude Opus 5.58.2 to 133.2 to 8.4

For the same number of tokens and today’s list prices, with 90% cache the APIs would cost from 1.5 to 8 times the $0.30; with 50% cache, from 3 to 13 times (for Opus 5.5 from 8.2 to 13, so the 10 falls within the range).

The comparison holds the tokens fixed: Abitbol says that Claude Code was launched “with strict budget limits” and that requests have increased. If Revolut uses more tokens today than before, the ratio between the prices of then and now should exceed 10, not stay below it. The “one-tenth” is therefore compatible with several explanations: more expensive models or higher prices back then (the list prices of January-April 2026 are not among the sources read), less cache, different volumes, or an invoice that includes something else. The talk does not say which.

What if we wanted to do it ourselves? What it takes

In short: you need very powerful compute cards in a single server; an ordinary computer is not enough.

The technical guide from vLLM, the program that runs the model, indicates for the official weights, compressed in FP8 format (a format that squeezes the model’s numbers so they fit in less memory), a server with 8 H200 GPUs (1,128 GB of memory in all). For the context of one million tokens (the maximum length of text the model can read) it indicates instead 8 B200s. H200, H100 and B200 are models of Nvidia compute cards.

GLM-5.3 has about 750 billion parameters, the model’s internal numbers: the more there are, the bigger the model and the more memory it takes (743 according to vLLM’s guide, 753 counted by Hugging Face, the site where models are downloaded, from the model files). The FP8 weights come to about 755 GB: they do not fit in an ordinary computer, but in a server with 8 very powerful compute cards.

  • The hardware. With 8 H100s (640 GB) they do not fit. With an even more compressed format (NVFP4, prepared by third parties) the weights drop to about 465 GB; how many cards are enough, the guide does not say.
  • The license is permissive: the details, with the conditions, are in the frequently asked questions.
  • A smaller variant, GLM-5.3-Flash (321 billion parameters, MIT license, which allows using the model almost without limits), still weighs about 306 GiB: it is not a model for a desktop computer.

These are figures declared by the projects: none of them has been tested on a GPU.

From how many developers is it worth it?

In short: with 1 or 10 developers it is never worth it; with 50 it is worth it against the APIs used the way Revolut uses them (against Opus even with the server always on, against Sonnet only with the server on during working hours); against Claude Ultra you are at the limit (47-56 developers, during working hours). For those who only want to use GLM, Z.ai’s plan costs less than the server at any team size, but the data goes to Z.ai.

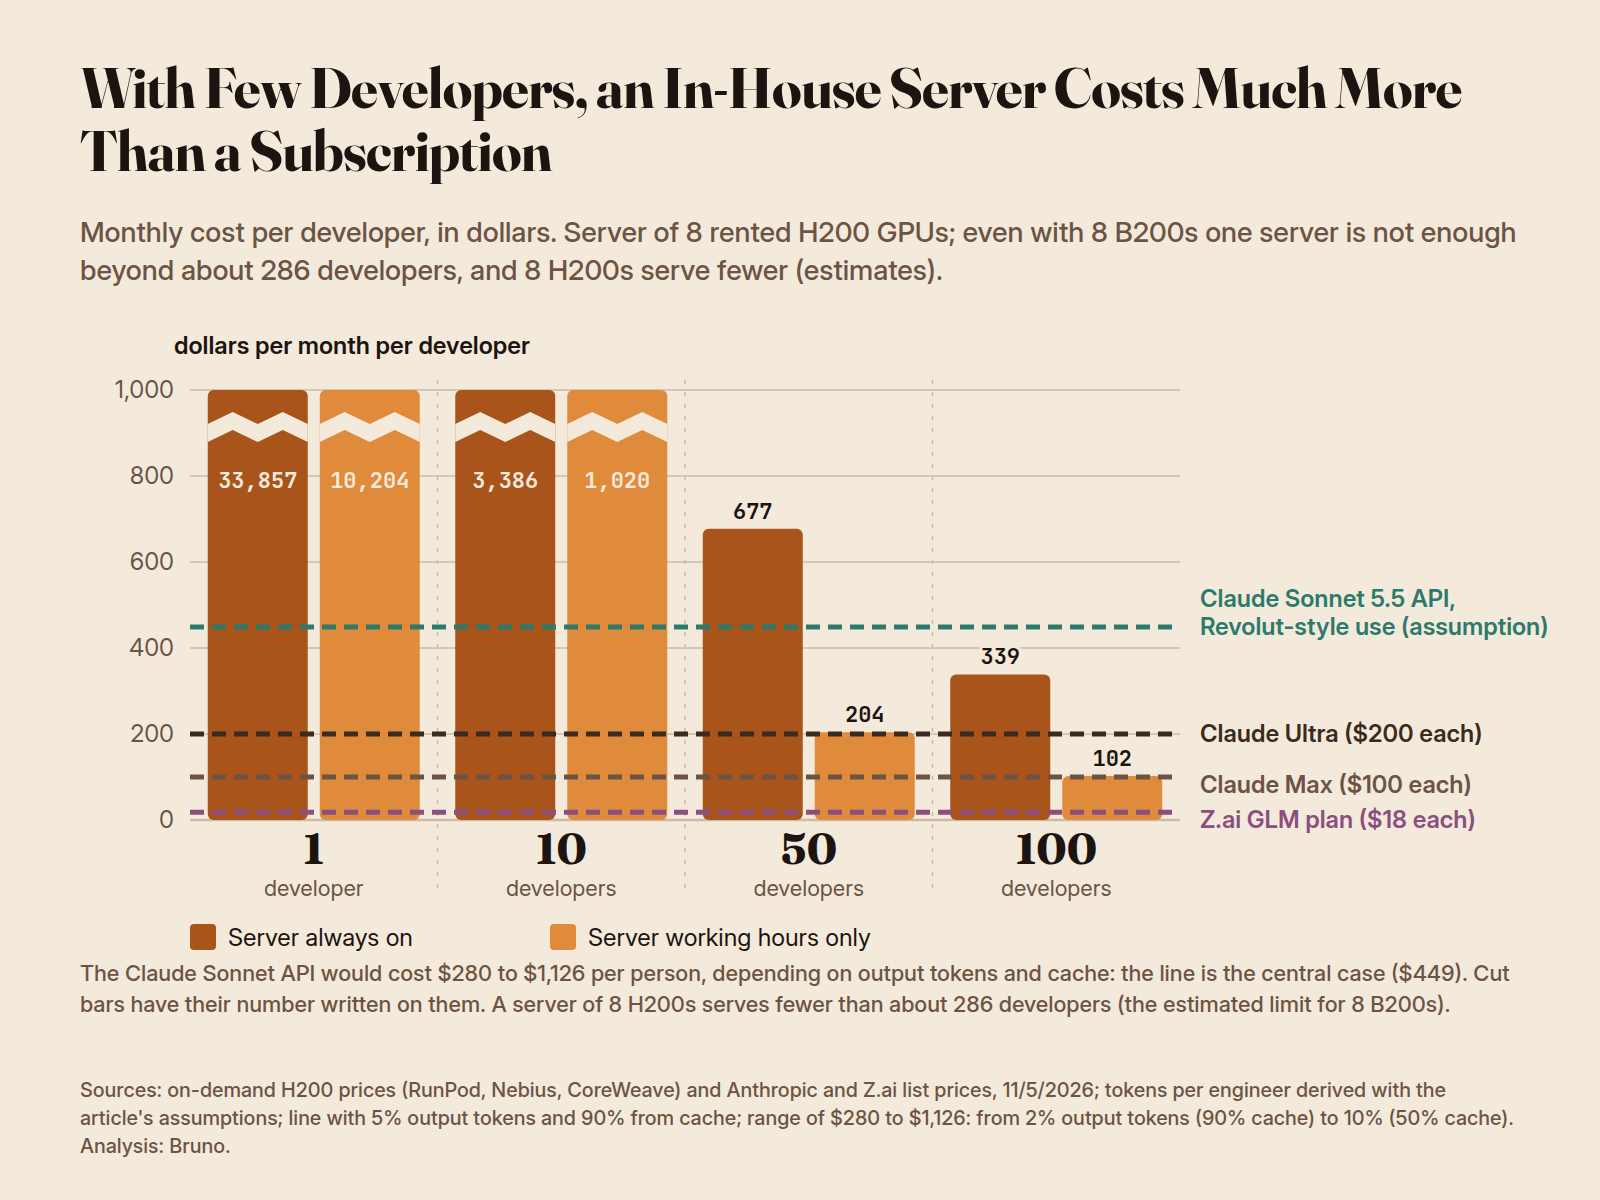
A rented server with 8 H200s costs from $30,900 to $36,800 a month always on, from $9,300 to $11,100 if on only during working hours (10 hours for 22 days). With 10 developers that is $930 to $1,110 each during working hours ($3,090 to $3,680 always on); with 50, $186 to $222 ($618 to $736).

The alternatives, per developer per month:

  • Z.ai’s plan for programming with GLM, $18 (the same model, without GPUs; the data goes to Z.ai);
  • Claude Pro $17 (billed annually; $20 a month if monthly), Claude Max $100, Claude Ultra $200 (monthly subscriptions from Anthropic for using Claude).

With the APIs, for someone who consumes like a Revolut engineer (about 580 million tokens a month, derived with the assumptions of the calculations): GLM-5.3 from Z.ai $333, Sonnet 5.5 $449, gpt-5.3-codex $588, Opus 5.5 $898.

From how many developers the 8-H200 server costs less than the alternative:

AgainstDuring working hours onlyAlways on
Z.ai GLM plan ($18)518-617 (beyond the capacity of one server)1,717-2,046 (beyond the capacity)
Claude Max ($100)94-111309-369 (beyond the capacity of one server)
Claude Ultra ($200)47-56155-185
Sonnet 5.5 API, Revolut-style use (assumption)21-2569-82
Opus 5.5 API, Revolut-style use (assumption)11-1335-41

These break-even points (the number of developers from which the server costs less) hold as long as one server is enough. With Revolut’s ratio (2,000 engineers on 56 B200s, about 36 per card) an 8-B200 server handles about 286; with 8 H200s it handles fewer, but this has not been measured.

The break-even against Claude Max with the server always on (309-369) is above this capacity: two servers would be needed, and the number does not hold. Revolut’s ratio comes from a carefully tuned system (time to first token, that is, the time that passes before the first word of the answer appears, from 14.26 to 1.68 seconds, according to the page): a small team might serve fewer developers per card.

Bars in dollars per month per developer, for 1, 10, 50 and 100 developers: the server with 8 H200s costs from 33,857 to 102 dollars, depending on the number of developers. With few developers the server costs much more than subscriptions.
Chart 2. “With Few Developers, an In-House Server Costs Much More Than a Subscription”: monthly cost per developer, for 1, 10, 50 and 100 developers (the 8-B200 server handles about 286, an 8-H200 server fewer: estimates); cost of the server: midpoint between the lowest and the highest price (RunPod, CoreWeave).

What the calculations do not count, and what the sources do not say

  • What the calculation does not include. Staff, network, space, monitoring, security and tuning work: according to the page, which describes a chart shown by Abitbol, the time to first token (the time that passes before the first word of the answer appears) fell from 14.26 to 1.68 seconds with the same number of GPUs; out loud Abitbol says “over 10 seconds” and “around 1.6.” The conference page says that self-hosting leaves Revolut responsible for lower costs, for security rules (sandbox) and for telemetry (the operating data needed to understand what happened if there is an incident).
  • Switching on, failures, updates and subscriptions. Shutting the server down in the evening means reloading 755 GB of weights in the morning; failures and updates are not in the calculation; subscriptions are a fixed cost per head, without comparing how much they allow you to use.
  • The data. Abitbol says, in general, that using the weights on a service based in the United States does not mean using a service that goes to China: it is his own statement, under conditions he sets, for programming tasks.
  • What Revolut’s invoice contains, which period it is compared with, who owns the GPUs, the tokens served. Out loud Abitbol gives about 3 requests per second in April and more than 7 in August, and also says “76% increased demand” (5:43:35); the page reports +76%. From about 3 to more than 7 would be more than double: the figures do not match and the talk does not explain why. In the sources read, no other document confirms the figures; the list prices are from November 5, 2026 and change often.

To the opening question the sources answer as follows: the calculations are consistent with Abitbol (the tokens are derived from the assumed cost), and with 90% cache the “one-tenth” is not explained by today’s prices alone. With 1 or 10 developers an in-house server costs more than the alternatives; from 50 it may be worth it against heavily used APIs; for those who only want GLM, Z.ai’s plan costs less at any team size.

These are calculations with declared assumptions, not purchase advice.

All that remains is to see whether Revolut, or others, will publish the overall cost and not just that of the tokens.

Frequently asked questions

How much does it cost to run GLM-5.3 the way Revolut does?

Rented, at the prices published on November 5, 2026, from $141,000 a month (CoreWeave’s maximum discount for committed use) to $403,000 (Lambda clusters); hourly, from $327,000 to $352,000. Revolut’s price is not known. The calculation starts from what Abitbol says: about 56 B200 GPUs for about 2,000 engineers.

From how many developers is it worth doing in-house?

With an 8-H200 server, from about 11 to 13 developers against Opus 5.5 APIs used like Revolut, and from about 94 to 111 against a Claude Max subscription, if the server is on only during working hours and handles that many (not measured). Always on, 35 to 185 developers are needed, depending on the alternative; against Claude Max (309-369) one server is not enough. With 1 or 10 developers it is never worth it.

Can GLM-5.3 be used for work?

According to the license as read on Hugging Face, yes: use, modification and fine-tuning are permitted, with the copyright notice to be kept and compliance with the law. Only those who offer an AI service to third parties with total revenue above $10 billion in 12 months must pass a security review by Z.ai. This is not legal advice.

Is Revolut’s “one-tenth” true?

It cannot be verified: it is a figure declared from the stage. The calculations make it consistent, but with 90% cache today’s prices alone do not explain it: for the same number of tokens the APIs would cost from 1.5 to 8 times the $0.30 per million, not 10 (with 50% cache, up to 13).

How many GPUs does it take to run GLM-5.3?

With the official weights in FP8 format, which come to about 755 GB, vLLM’s technical guide indicates a server with 8 H200 GPUs (Nvidia compute cards; 1,128 GB of memory in all), or 8 B200s for the context of one million tokens. With 8 H100s (640 GB) they do not fit. With an even more compressed format (NVFP4, prepared by third parties) the weights drop to about 465 GB; how many cards are enough, the guide does not say.

How much was Revolut spending before?

It is an estimate, not a figure: if today’s invoice is one-tenth (assumption: only the rental of the 56 GPUs), before that Revolut was spending about $3.5 million a month on the AI that writes code, about $1,700 per engineer, with a range from 1.4 to 4.0 million depending on the price of the GPUs. Abitbol does not say which period the “one-tenth” refers to.

Read also

Methodology note (for those who want to check the calculations)

A token check: with 5% output tokens, each card would have to generate from 370 to 400 tokens per second. At the speed of 200 tokens per second per conversation that Abitbol states, that is about 110 simultaneous conversations on average, 5-6% of the 2,000 engineers: plausible, not verifiable (the vLLM and SGLang recipes do not publish the speed per card).

I read the talk’s page (https://ai.engineer/nyc/2026/talks/revolut) and its transcript on November 5, 2026; the transcript, the page says, is automatic and may contain errors. The timestamps are those of the livestream recording. The prices of GPUs, APIs and subscriptions are the list prices published on the suppliers’ pages and read on November 5, 2026. The calculations were redone in R from the input data, which I keep with source and time of reading.

Declared assumptions:

  • a month of 730 hours; “during working hours” = 10 hours for 22 days = 220 hours;
  • prices published on November 5, 2026: on-demand (RunPod, Nebius, CoreWeave), Lambda clusters, CoreWeave’s maximum discount; the price list for Lambda’s instances, which will take effect on November 16, 2026 (until then it can only be seen with an account), is outside the calculations; Revolut’s price is not known;
  • the 30 cents are the cost divided by all the tokens served, cache included; today’s invoice is only the rental of the 56 GPUs;
  • “one-tenth” also read as between 8% and 12%;
  • average API price: 2-10% output tokens, cache at 50% or 90% (scenarios), cache writes not counted (the APIs come out a little cheaper than the real figure: for Opus 5.5 from 3.6 to 8.7 times instead of 3.2-8.4), today’s list prices;
  • “Revolut-style use”: about 580 million tokens a month per engineer (from 230 to 670 depending on the price), total tokens derived divided by 2,000, with 5% output tokens and 90% cache;
  • capacity of one server: Revolut’s ratio (about 36 developers per B200).

The 90% cache threshold is advice from Abitbol on the parameters to tune (“check your cache hit, coding test needs to be above 90% cache hit,” according to the automatic transcript, which is unclear). The quotations from the talk, with their timestamps:

  • “to serve 2,000 engineers, we roughly need 56 B200” (5:41:18);
  • “blended cost of token is 30 cents per million” (5:42:17-5:42:19); “And so our invoice is one-tenth of what we were spending on Anthropic and OpenAI” (5:42:22-5:42:24);
  • “request per second around 3” (5:43:08); “requests per second were over 7” (5:43:28); “88% improvement in performance for 76% increased demand” (5:43:35); “time to first token over 10 seconds” (5:43:15); “we’re around 1.6” (5:43:28); “We serve, in terms of interactivity, 200 tokens per second” (5:41:48-5:41:51);
  • “engineers spend a thousand a month, 10,000 a month” (5:39:36-5:39:39); “we launched it with strict budget limits” (5:39:43);
  • “So obviously we keep using codex, code code… But we keep them as exception” (5:40:59-5:41:07; “code code” is read as “Claude Code” because at 5:47:04-5:47:07 the same transcript has “And the sandbox means now if you’ve used Codex Claude Code, it has all of these features of approve for me”; the reading is not confirmed by the audio);
  • “you’re not using inference, dedicated endpoint that goes to China. you’re just getting the weights and putting them on a US-based service” (5:46:21-5:46:27).

Sources

Consulted on November 5, 2026. I mark the type of each source: primary (who says or produces the figure), price list (public prices), project (documentation from whoever serves the model).

  1. AI Engineer NYC 2026, “Shipping like a startup, regulated like a bank,” David Abitbol (Revolut), October 13, 2026: the talk’s page (summary with no author stated) and automatic transcript. Primary for the spoken word; the summary has no stated author. https://ai.engineer/nyc/2026/talks/revolut
  2. Livestream of the conference on YouTube, from 5:36:54 to 5:48:28 of the recording. Primary. https://www.youtube.com/watch?v=akEqiXFo3GM
  3. GPU rental prices: Lambda https://lambda.ai/pricing; RunPod https://www.runpod.io/pricing; Nebius https://nebius.com/prices; CoreWeave https://www.coreweave.com/pricing. Price list.
  4. API and subscription prices: Anthropic https://platform.claude.com/docs/en/about-claude/pricing and https://claude.com/pricing; OpenAI https://platform.openai.com/docs/pricing; Z.ai https://docs.z.ai/guides/overview/pricing and https://docs.z.ai/devpack/overview. Price list.
  5. Hugging Face, zai-org/GLM-5.3 (model card, configuration, license) and zai-org/GLM-5.3-Flash. Primary. https://huggingface.co/zai-org/GLM-5.3 and https://huggingface.co/zai-org/GLM-5.3-Flash
  6. vLLM recipes, GLM-5.3: https://recipes.vllm.ai/zai-org/GLM-5.3; SGLang cookbook, GLM-5.3: https://cookbook.sglang.io/autoregressive/GLM/GLM-5.3. Project.
  7. NIST CAISI, “CAISI’s Assessment of Z.ai’s GLM-5.3 Cyber Capabilities,” September 17, 2026 (identifies Z.ai as a China-based company, formerly Zhipu AI, and GLM-5.3’s release on August 14, 2026). Primary, independent. https://www.nist.gov/news-events/news/2026/09/caisis-assessment-zais-glm-53-cyber-capabilities
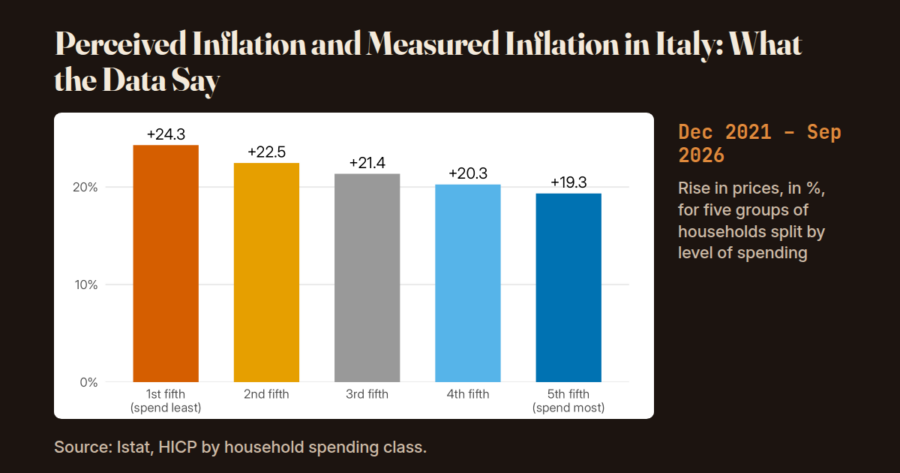
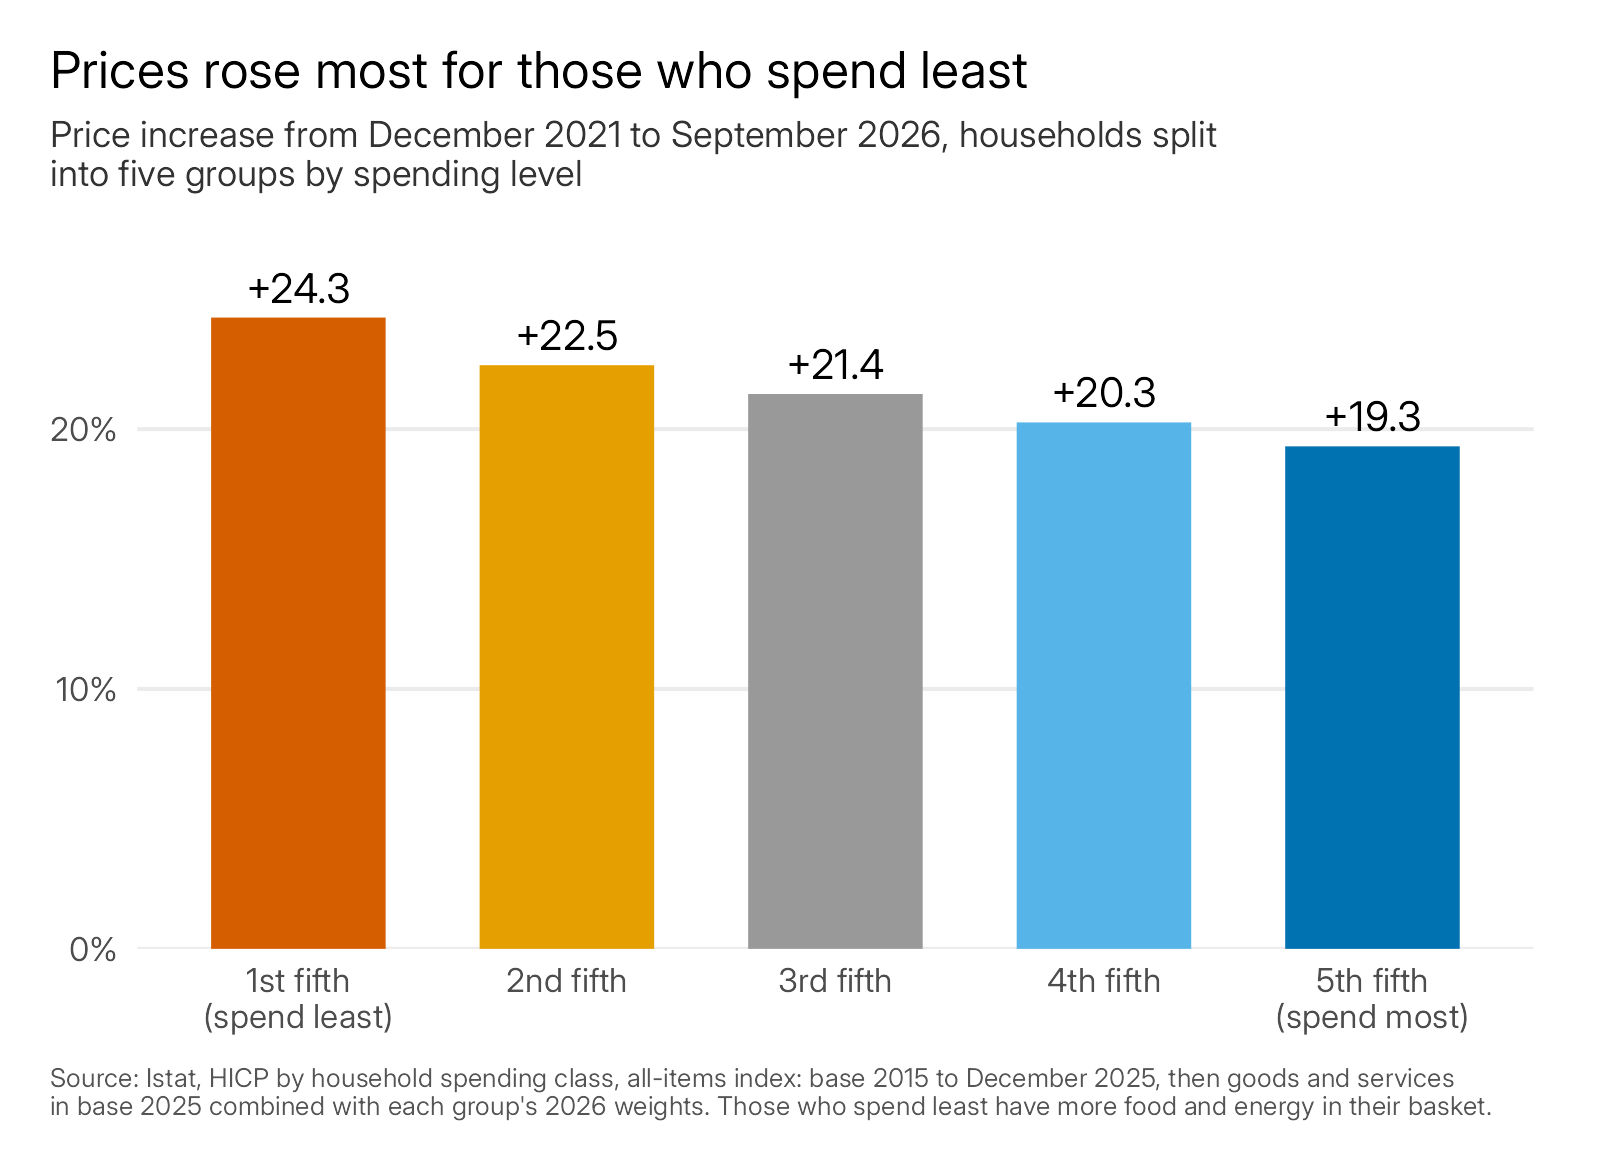
Title “Perceived Inflation and Measured Inflation in Italy: What the Data Say” above a bar chart of price rises from December 2021 to September 2026 for five household groups: +24.3% (spend least) to +19.3% (spend most). Source: Istat.

Perceived Inflation and Measured Inflation in Italy: What the Data Say

“They say inflation is 5%… but they’re lying.” That is how an Instagram carousel from the account angelogrecoofficial begins, the cover of a series of slides on grocery spending. Istat, Italy’s national statistics office, measured in October a rise in prices of 5.4% over one year; a poll, whose question the press accounts do not report, speaks instead of perceived inflation of 13.3%. Who is right?

To answer, I checked the carousel’s figures and set them beside the official data, in nine steps: from the carousel’s figures to the limits of the numbers.

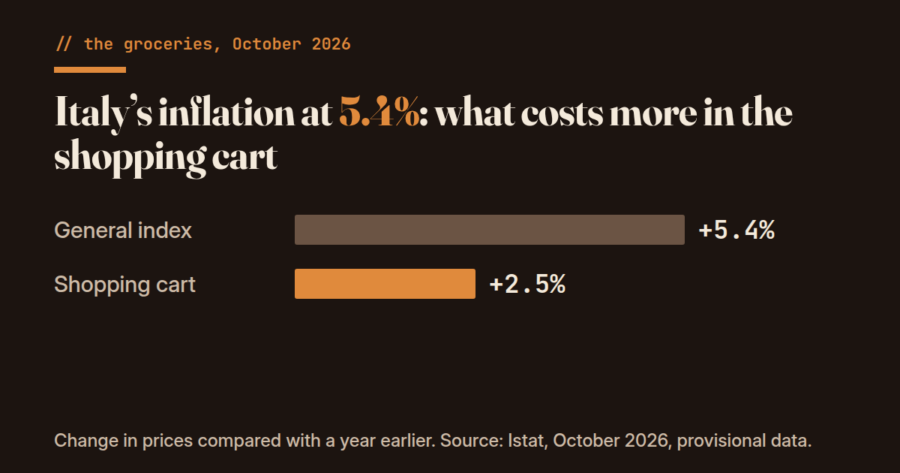
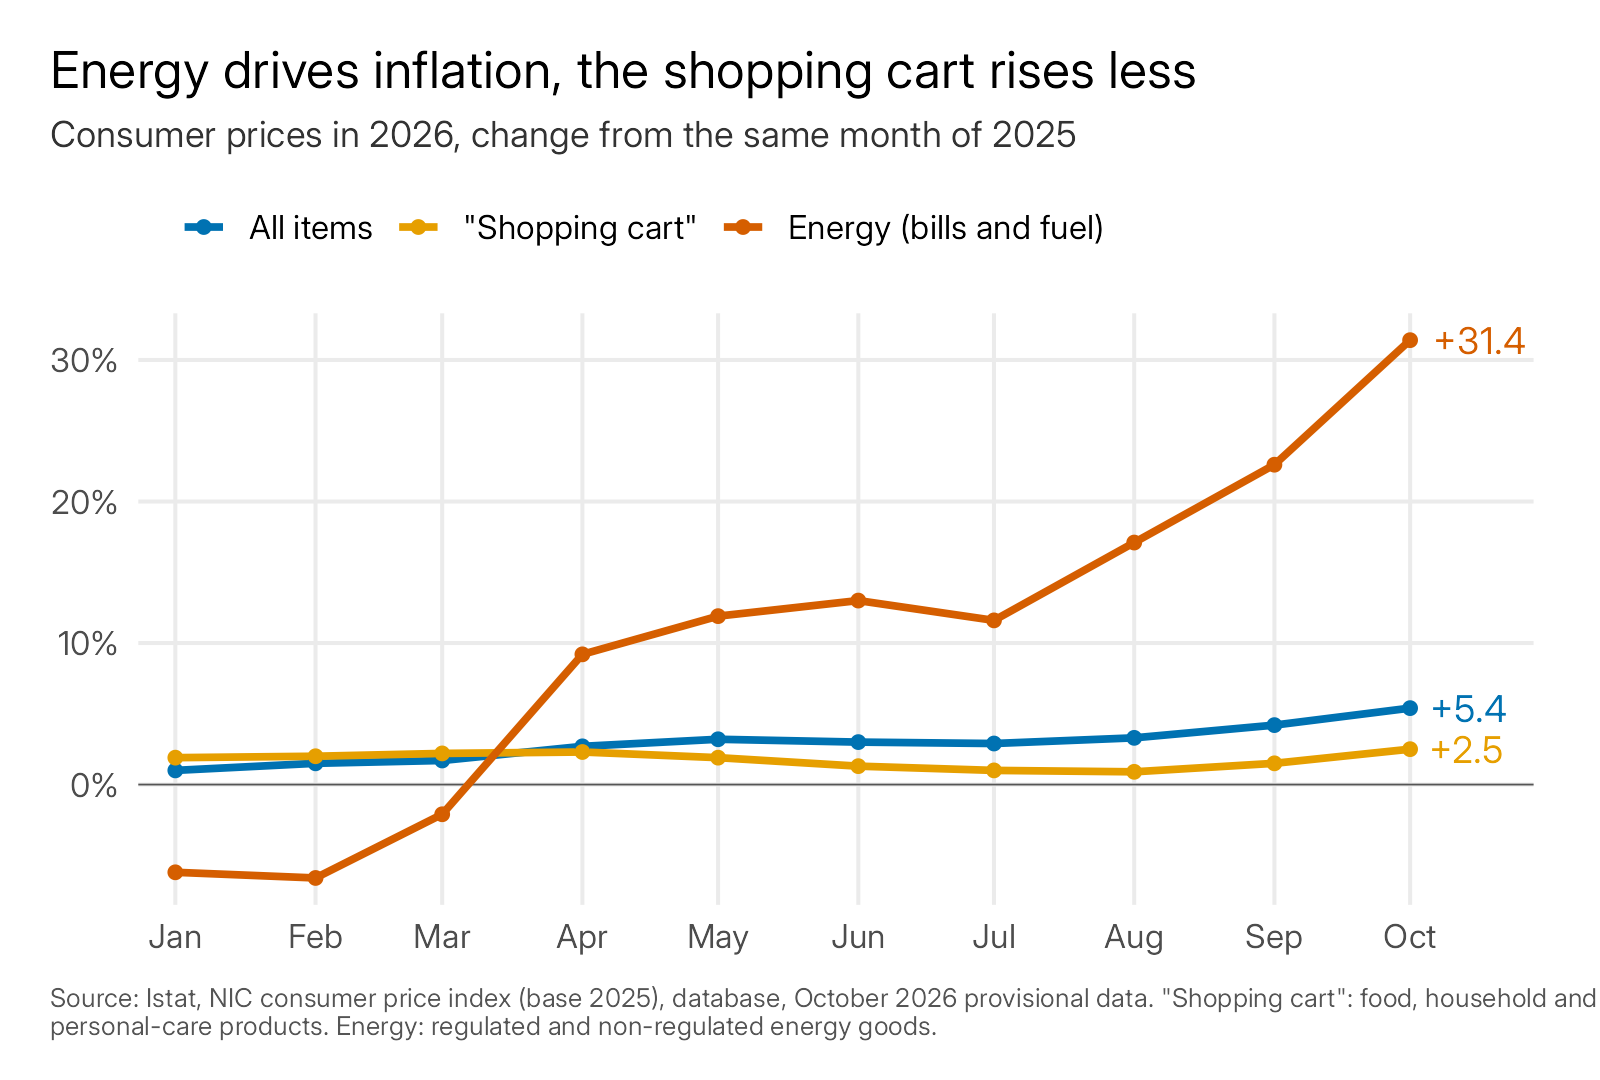
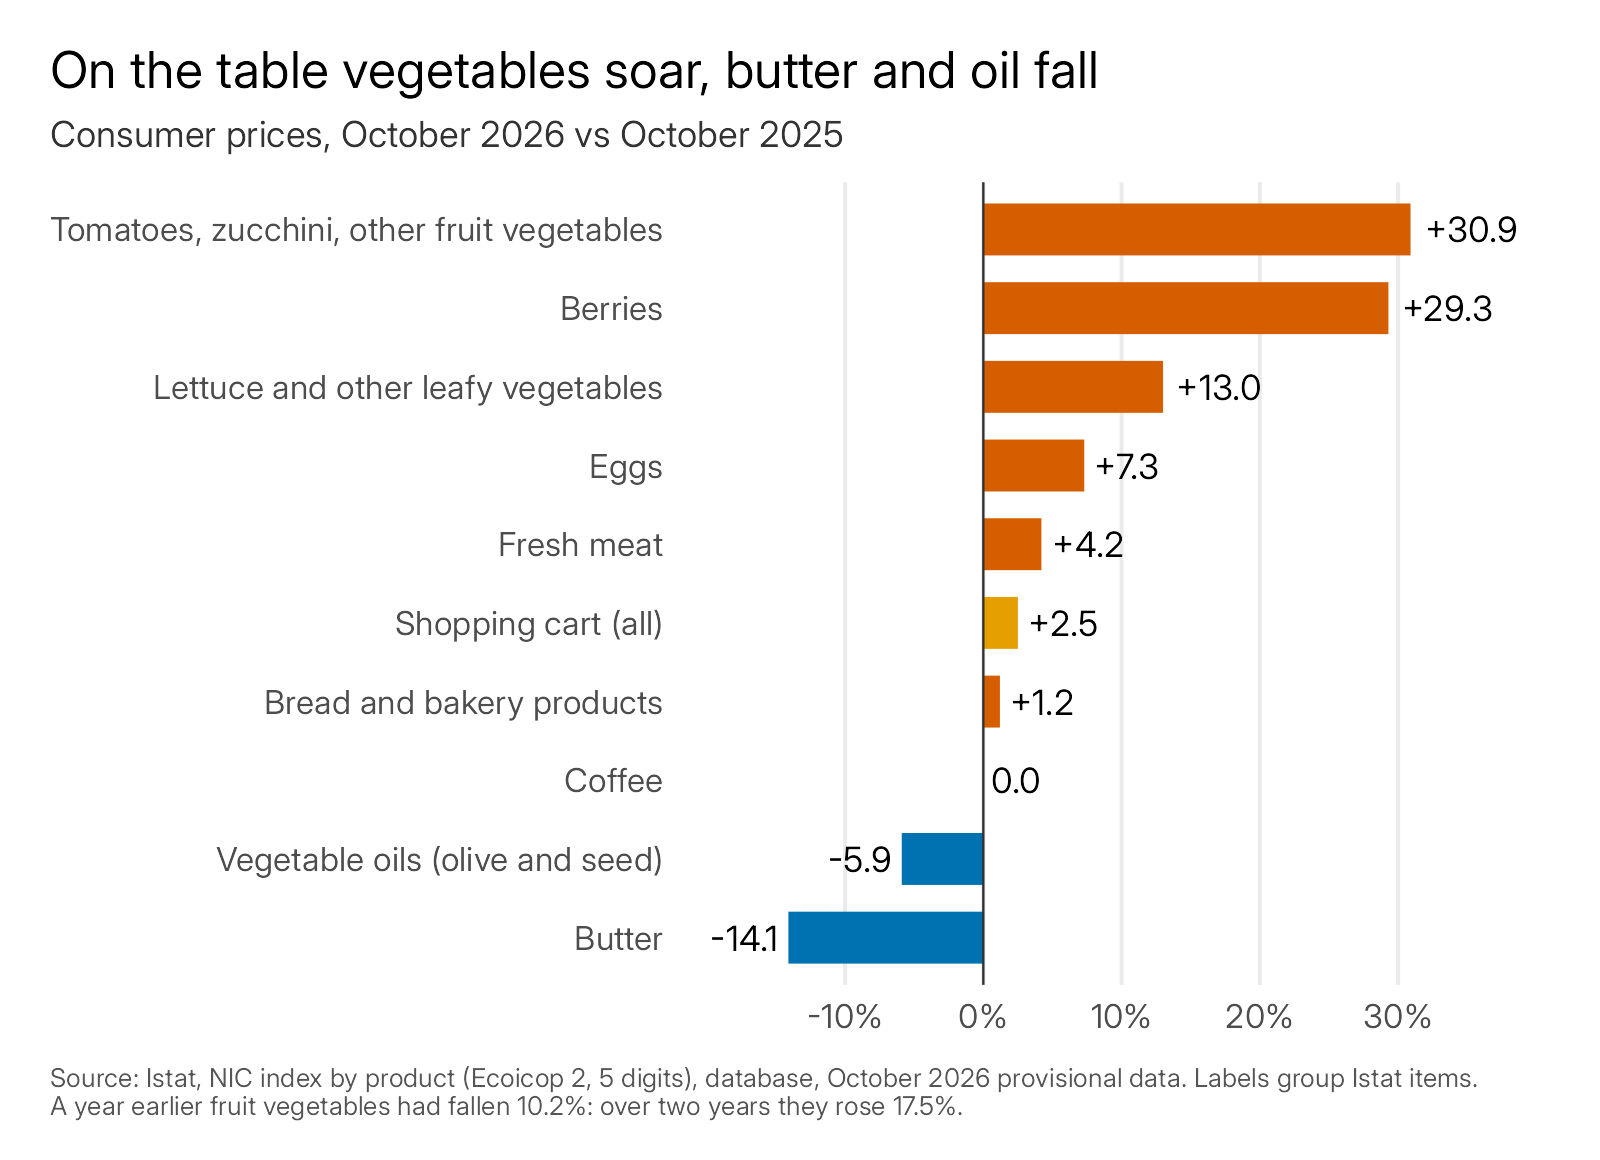
I have already written about October’s prices, and about what rose in the shopping cart, in “Italy’s Inflation at 5.4%: What Costs More in the Shopping Cart”: I do not repeat it here.

What holds up in the carousel’s figures?

The carousel cites five numbers. Here is what can be checked, according to the data I gathered.

Carousel figureVerdictWhat the sources say
October inflation +5.4%TrueIstat, provisional data, October 30, 2026
Perceived price rises 13.3%True as a poll resultthe polling institute Noto Sondaggi for Il Sole 24 Ore (an Italian business daily), 2,000 people interviewed October 14-19; the press review and the news agency do not report the question or the method
Shopping cart +27.8% since the end of 2021Partly trueWith Istat’s definition the shopping cart is at +25.6%; the 27.8% is close to the +28.1% for food alone
52% changed their habits; 26% cut back on fish and seafood; 20% on red meatNot checkedThey are in the article in Il Sole 24 Ore, which is behind a paywall
Examples with 100 euros (105.40 with the 5.4%; “almost 128” with the 27.8%)TrueThey are arithmetic

The shopping cart, in Istat’s definition, includes food, household products and personal-care products. Il Sole 24 Ore has a basket of its own with 31 products (+29.5% from 2021 to 2026, according to ANSA, Italy’s leading news agency): which one is used for the 27.8% is not written in the carousel.

That leaves the word on the cover, “lying.” The carousel itself says, in its slides, that the 13.3% is a perception and does not replace Istat’s figure. The cover is harsher than the content.

What do we perceive, and what does Istat measure?

Istat calculates inflation with a price index for what people actually buy. Perception, by contrast, is measured by asking people. The European Central Bank’s (ECB) monthly survey of households, about 19,000 people in 11 euro-area countries, Italy included, asks people by how much, in their view, prices have changed over the past 12 months.

The answers are summarized in two ways. The median is the middle answer: half of the people say more, half say less. The mean adds everything up and rises when some people give very high values.

The ECB series and the spending-group series run through September 2026; October’s 5.4% is provisional. That is why the comparison is with Istat’s figure for the same month.

MonthPerceived, medianPerceived, meanMeasured (Istat)
October 202211.2%17.3%11.8%
October 202310.1%15.4%1.7%
October 20244.9%8.1%0.9%
October 20255.0%9.1%1.2%
September 20265.0%9.0%4.2%

Three things come out of it:

  • In 2022, at the peak of prices, the “typical” person perceived almost exactly the measured inflation: 11.2% against 11.8%.
  • Today the gap is small: 5.0% against 4.2%. It was only this small in October 2022; in the other months of the table it was almost 4 percentage points or more.
  • In between, perception fell much more slowly than prices: in October 2023, 10.1% against 1.7%.

The poll’s 13.3% from Noto and the ECB’s 5.0% cannot be set side by side without caution. They are two different surveys, with different questions and samples. If the 13.3% were a mean, and that is not stated, the right comparison would be with the ECB’s 9.0%.

Why did perception stay high in 2024 and 2025?

In 2024 and 2025 measured inflation was 1.3%, on average over the months. Median perception was about 5%: about four times higher. It is the figure that surprises most.

One possible explanation is the memory of prices. Inflation that slows down does not bring prices back down: it makes them grow more slowly from a level that is already higher. Anyone who remembers what groceries cost in 2021 keeps seeing a more expensive receipt, even when the rise over the last year is small.

This is an interpretation: the ECB data do not measure it. They say that perception stayed high; they do not say why.

An example shows why the two numbers can coexist. “Slowing down” does not mean “costs less”: if a product goes from 100 to 120 euros and the next year rises by 2%, it costs 122.40. The rate is low, the price is higher than before.

How much have prices risen since the end of 2021?

From the end of 2021 to October 2026 the rise in prices, according to Istat’s indexes, is this:

  • General index (the NIC, the price index Istat uses every month for “official” inflation; everything that is bought): +21.4%.
  • Shopping cart (food, household products and personal-care products): +25.6%.
  • Food only: +28.1%.

I calculated the changes from Istat’s indexes.

In practice, what cost 100 euros in the shopping cart at the end of 2021 costs about 126 today and, if it is only food, about 128. Il Sole 24 Ore’s +27.8% sits in between, closer to food than to the shopping cart. The carousel is not far off: the definition matters.

Since December 2021 prices are 21.4% higher (25.6% in the shopping cart): it is the rise in the level of prices, not a measure of perception over the last 12 months.

Istat publishes two price indexes: the NIC, the one for each month’s inflation, and the HICP, the EU-harmonized index of consumer prices, calculated with the same rules across Europe so that countries can be compared. They measure the basket in slightly different ways and give slightly different results: I use the NIC for general comparisons and the HICP for groups of households. (For U.S. readers: the NIC is Italy’s national consumer price index for the whole population, the Italian counterpart of the CPI; it is not the U.S. CPI.)

Is the average the same for all households?

No. Istat also publishes inflation for groups of households. It divides households into five groups of equal size according to how much they spend, taking into account how many people are in the household, and for each group it calculates an index with the weights of its spending. Here I use the HICP, which Istat publishes for these groups.

Bar chart of the rise in prices from December 2021 to September 2026 for five groups of households: +24.3% for those who spend least, +22.5%, +21.4%, +20.3%, +19.3% for those who spend most.
Rise in prices from December 2021 to September 2026, households divided into five groups by level of spending. Source: Istat, HICP by spending group (2025 base).

From the end of 2021 to September 2026 prices rose by 24.3% for the fifth of households that spends the least and by 19.3% for the fifth that spends the most (Istat, indexes by spending group). The gap is 5 percentage points. For comparison, the HICP for all households, over the same period, is +20.9%.

In 2022, the worst moment, inflation was 18.6% for the households that spend the least and 9.9% for those that spend the most (October 2022, compared with a year earlier; with the other index, the NIC in the table above, it was 11.8%; the HICP for all households was 12.6%).

The reason is in the basket, that is, in the list of products and services that people buy and that the index measures: for the households that spend the least, energy accounts for 17% of spending, for those that spend the most 7% (Istat, 2026: how much each item weighs in household spending). The carousel senses it in its own words (“if prices rise mainly on the things you can’t do without, your budget can suffer more than the average figure suggests”): here is the number.

It is not always so. In 2024, when energy fell, the households that spend the least had less inflation than the others: 0.1% against 1.6%, annual averages from Istat.

The average describes the whole; it does not say how each group is doing.

What about contractual wages?

To understand whether spending weighs more, one also has to look at how much people earn. Istat publishes contractual wages per employee, that is, the minimums set by national labor contracts: they are not actual salaries.

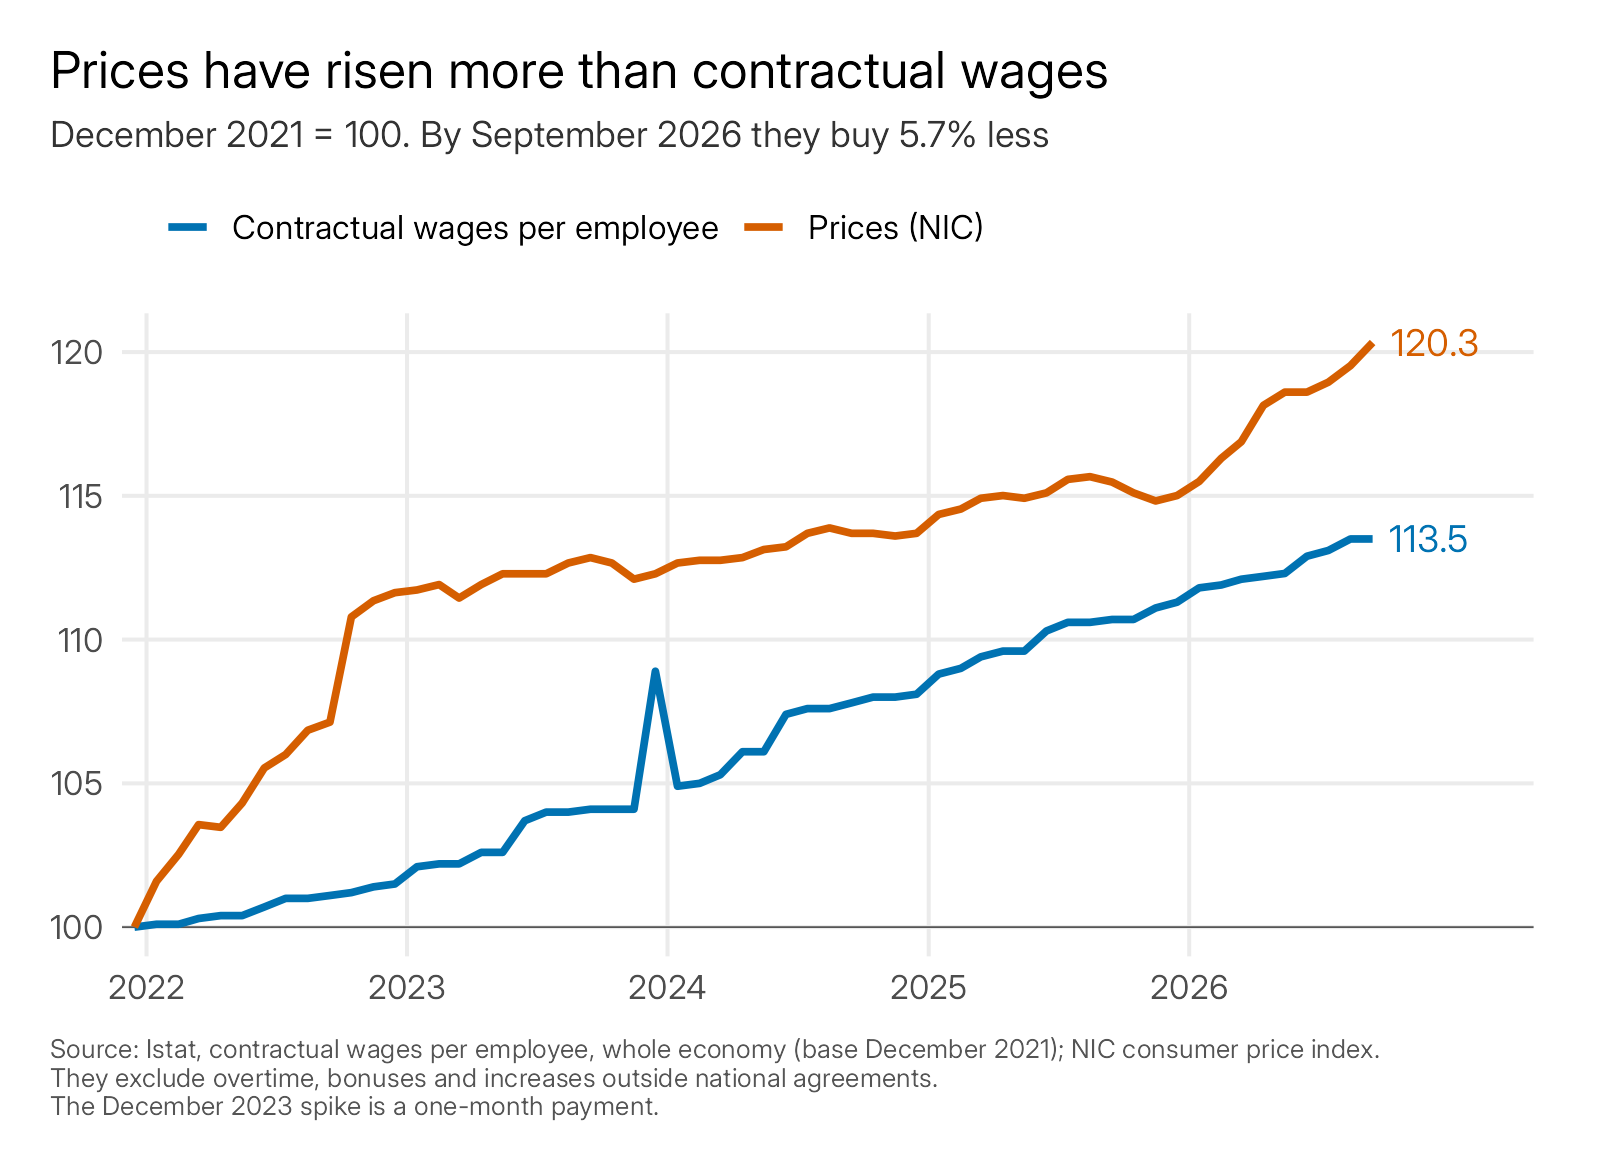
Line chart, December 2021 = 100: in September 2026 prices (NIC) stand at 120.3 and contractual wages at 113.5, with an isolated spike in December 2023; in September 2026 purchasing power is down 5.7%.
Prices (NIC) and contractual wages per employee, from December 2021 (= 100) to September 2026. Source: Istat.

From December 2021 to September 2026, the latest month available for wages:

  • Contractual wages: +13.5%.
  • Prices (NIC, the index Istat uses for each month’s inflation): +20.3%.

With the NIC, purchasing power, that is, how much one can buy with the same wage, is down 5.7%; with the HICP, the index used for the spending groups, 6.2%. The lowest point was December 2022 (−9.1%): since then wages have recovered in part, but in 2026 prices have started to run again.

Two limits, each tied to the data. The comparison starts in December 2021, the carousel’s date and the point just before the 2022 climb: with a different starting date the result would change. And contractual wages do not include overtime, company bonuses and raises outside the national contracts: actual wages may be somewhat different.

What do the cutbacks say?

The carousel asks its readers: “what did you have to give up?” The closest official figure comes from Istat, in its report on household consumption expenditure for 2025.

  • 29.4% of households limited their spending on food, reducing quantity or quality: almost three in ten. In 2024 it was 31.1%: the share has fallen.
  • Clothing and footwear: 43.8% of those who buy them limited their spending; in southern Italy (the Mezzogiorno), 52.1%.

These are 2025 figures, and so predate the rise in inflation in 2026. They are not comparable with the carousel’s 52%, whose question is unknown: the two numbers measure different things.

What do the numbers say, taken together?

Lined up, the data say things that the carousel and the headlines leave separate:

  1. The 5.4% is true, as an average of the prices of what households buy.
  2. Perception follows prices at the peak and stays higher than measured inflation when prices slow. In 2022 the typical figure was close to Istat’s (11.2% against 11.8%); in 2024-2025 it was about four times higher (about 5% against 1.3%, monthly averages). The ECB data do not say why.
  3. The average hides the differences. For the fifth of households that spends the least, prices have risen by 24.3% since the end of 2021, for the fifth that spends the most by 19.3%: a gap of 5 points.
  4. Since December 2021, contractual wages have grown less than prices, on average: purchasing power is at −5.7%.

So “lying” does not hold up: the 5.4% is a true average. But an average does not say how each household is doing. The data on spending groups show that those who spend less have seen prices rise more, and the data on contractual wages that they have risen less than prices. Why perception stays higher than measured inflation, however, the data do not say.

What can’t the numbers say?

Three limits, to keep in mind.

  • The Noto poll. The question and the method do not appear in the accounts that could be read; the Il Sole 24 Ore article is behind a paywall. The 13.3%, the 52%, the 26% and the 20% remain unchecked figures.
  • Wages. They are only those of the national contracts, and they do not say what each person earns.
  • Why perception stays high. That it is the memory of earlier prices is a reasonable hypothesis; the ECB survey does not measure it.

All that remains is to see, in the coming months, whether perception will follow prices when they slow, as it did not in 2024 and 2025.

Frequently asked questions

Is inflation really at 5.4%?

Yes, according to Istat, inflation in October 2026 is 5.4% compared with October 2025: it is a provisional figure, and Istat publishes the final one on November 17. It is an average of the prices of what people buy, so it does not coincide with what each household feels.

What is the difference between perceived inflation and measured inflation?

Measured inflation is the one Istat calculates from hundreds of thousands of prices collected every month. Perceived inflation is the one people state in surveys. In September 2026, in the ECB survey, median perceived inflation in Italy was 5.0% and measured inflation 4.2%.

How much have prices risen since the end of 2021?

According to Istat’s indexes, in October 2026 prices are 21.4% higher than in December 2021. The shopping cart is at +25.6% and food alone at +28.1%. These are changes in the level of prices over time, not the inflation of the last 12 months: they say how much more what cost something at the end of 2021 costs today. The shopping cart includes food, household products and personal-care products.

Have households that spend less had bigger price increases?

Yes, according to Istat, but the gap is 5 points: from December 2021 to September 2026 prices rose by 24.3% for the fifth of households that spends the least and by 19.3% for the fifth that spends the most. One reason is in the basket: for those who spend less, energy accounts for 17% of spending, for those who spend more 7% (Istat weights, 2026).

Have wages grown as much as prices?

No: from December 2021 to September 2026 contractual wages rose by 13.5% and prices by 20.3%. Purchasing power is down 5.7%, according to Istat. They are the minimums of the national contracts, not every salary. Purchasing power is the quantity of goods one can buy with the same wage.

Download the data and the code

I have gathered in a zip file the data and the code with which I redid the calculations, so that anyone who wants to can repeat the analyses. Inside are the processed tables in CSV files, that is, plain-text tables (perceived and measured inflation, spending groups, contractual wages), the scripts that redo the calculations and draw the two charts, written in R, a language for data analysis, and a file of instructions. The original Istat and ECB data are not in the file: they can be downloaded from the sites listed in the sources. Download the data and the code for the analysis (zip): 22 KB (22,474 bytes), file dated November 3, 2026, SHA-256 c6650d2f7cce075d26d28ee73ee0a922484fbafdd54166d0b098761b65fc27b7.

Method note (for those who want to check the math)

The changes since 2021 are calculated on the NIC, the consumer price index for the whole population, Istat series by type of product (2015 base through December 2025, 2025 base from 2026, linked on the 2025 average). The spending groups use the HICP: for each group Istat calculates an index with the weights of its spending, drawn from the household expenditure survey. For 2026 Istat publishes for each group the index for goods and the one for services, not the general index: I combined them with the 2026 weights of each group, as is done for a harmonized index, with an estimated error of about 0.1 points (redone on 2025, where the general index exists, the error is at most 0.11). The comparison through December 2025 is entirely Istat data: +18.3% for those who spend least and +15.0% for those who spend most. With the HICP for all items, official through December 2025 and for 2026 derived from goods and services with the 2026 weights, the rise in prices from December 2021 to September 2026 is +20.9% and purchasing power −6.2%. As a check I compared the shopping cart in the 2025 average with the 2021 average: +24.0%, which matches the Istat figure reported by ANSA in January.

The comparison between perceived and measured inflation uses for the ECB survey the median and mean series for Italy; measured inflation is Istat (NIC) for the same month. The 2024-2025 average of median perception is 5.4% and that of measured inflation 1.3%: they are averages of the monthly data.

The December 2023 spike in wages is a one-month payment. The data were downloaded on November 2, 2026 (the spending groups and the weights on November 3); the R code is in the zip file.

Sources

Accessed November 2 and 3, 2026. I mark the type of each source: primary (whoever produces the data), derived (calculated from primary data), secondary. Titles of Italian sources are in the original, with an English translation in brackets. Quotations from Italian-language sources are my translations.

  1. Istat, release “Prezzi al consumo, dati provvisori ottobre 2026” [“Consumer prices, provisional data October 2026”], October 30, 2026. Primary. https://www.istat.it/comunicato-stampa/prezzi-al-consumo-dati-provvisori-ottobre-2026/
  2. Istat, database (NIC by type of product; HICP by household spending group and the related 2026 weights; contractual wages), accessed November 2 and 3, 2026. Primary; derived from primary data. https://esploradati.istat.it/
  3. ECB, Consumer Expectations Survey, household survey, series for Italy (median and mean 12-month perceived inflation). Primary. https://data.ecb.europa.eu/data/datasets/CES
  4. Istat, “Le spese per i consumi delle famiglie, anno 2025” [“Household consumption expenditure, 2025”], October 8, 2026, p. 4. Primary. https://www.istat.it/wp-content/uploads/2026/10/REPORT_Spese-per-consumi-2025.docx.pdf
  5. Eurostat, harmonized indices of consumer prices (prc_hicp_midx), for the check of the HICP for all households. Primary. https://ec.europa.eu/eurostat/databrowser/view/prc_hicp_midx/default/table
  6. Instagram, account angelogrecoofficial, carousel with the cover “Dicono che l’inflazione è al 5%… ma mentono” [“They say inflation is 5%… but they’re lying”], 11 slides, read on November 2, 2026. Secondary. https://www.instagram.com/p/DfOrokvCGIz
  7. Noto Sondaggi for Il Sole 24 Ore, poll of October 14-19, 2026 (2,000 interviews), front page of November 2, 2026, read through a press review and the news agency. Secondary; the question and the method do not appear in the accounts that could be read.
  8. ANSA, “Italy’s shopping trolley price index has risen 24% since 2021,” January 16, 2026, https://www.ansa.it/english/news/2026/01/16/italys-shopping-trolley-price-index-has-risen-24-since-2021_1710747e-9bd0-485b-9e85-b22bc675c1cd.html ; ANSA, “In Italia carrello della spesa più caro del 29,5% in 5 anni” [“In Italy the shopping cart is 29.5% more expensive in 5 years”] (Il Sole 24 Ore basket), August 31, 2026, https://lavocedinewyork.com/ansa/2026/08/31/in-italia-carrello-della-spesa-piu-caro-del-295-in-5-anni/ (copy of the agency’s report). Secondary.
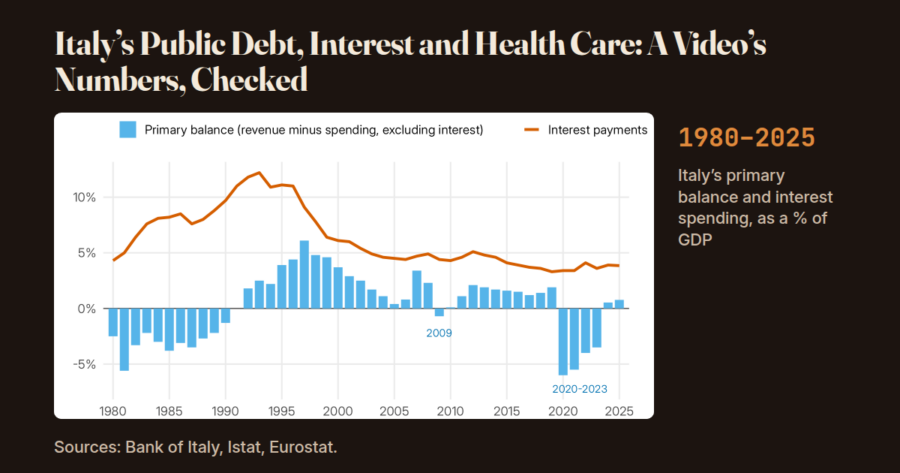
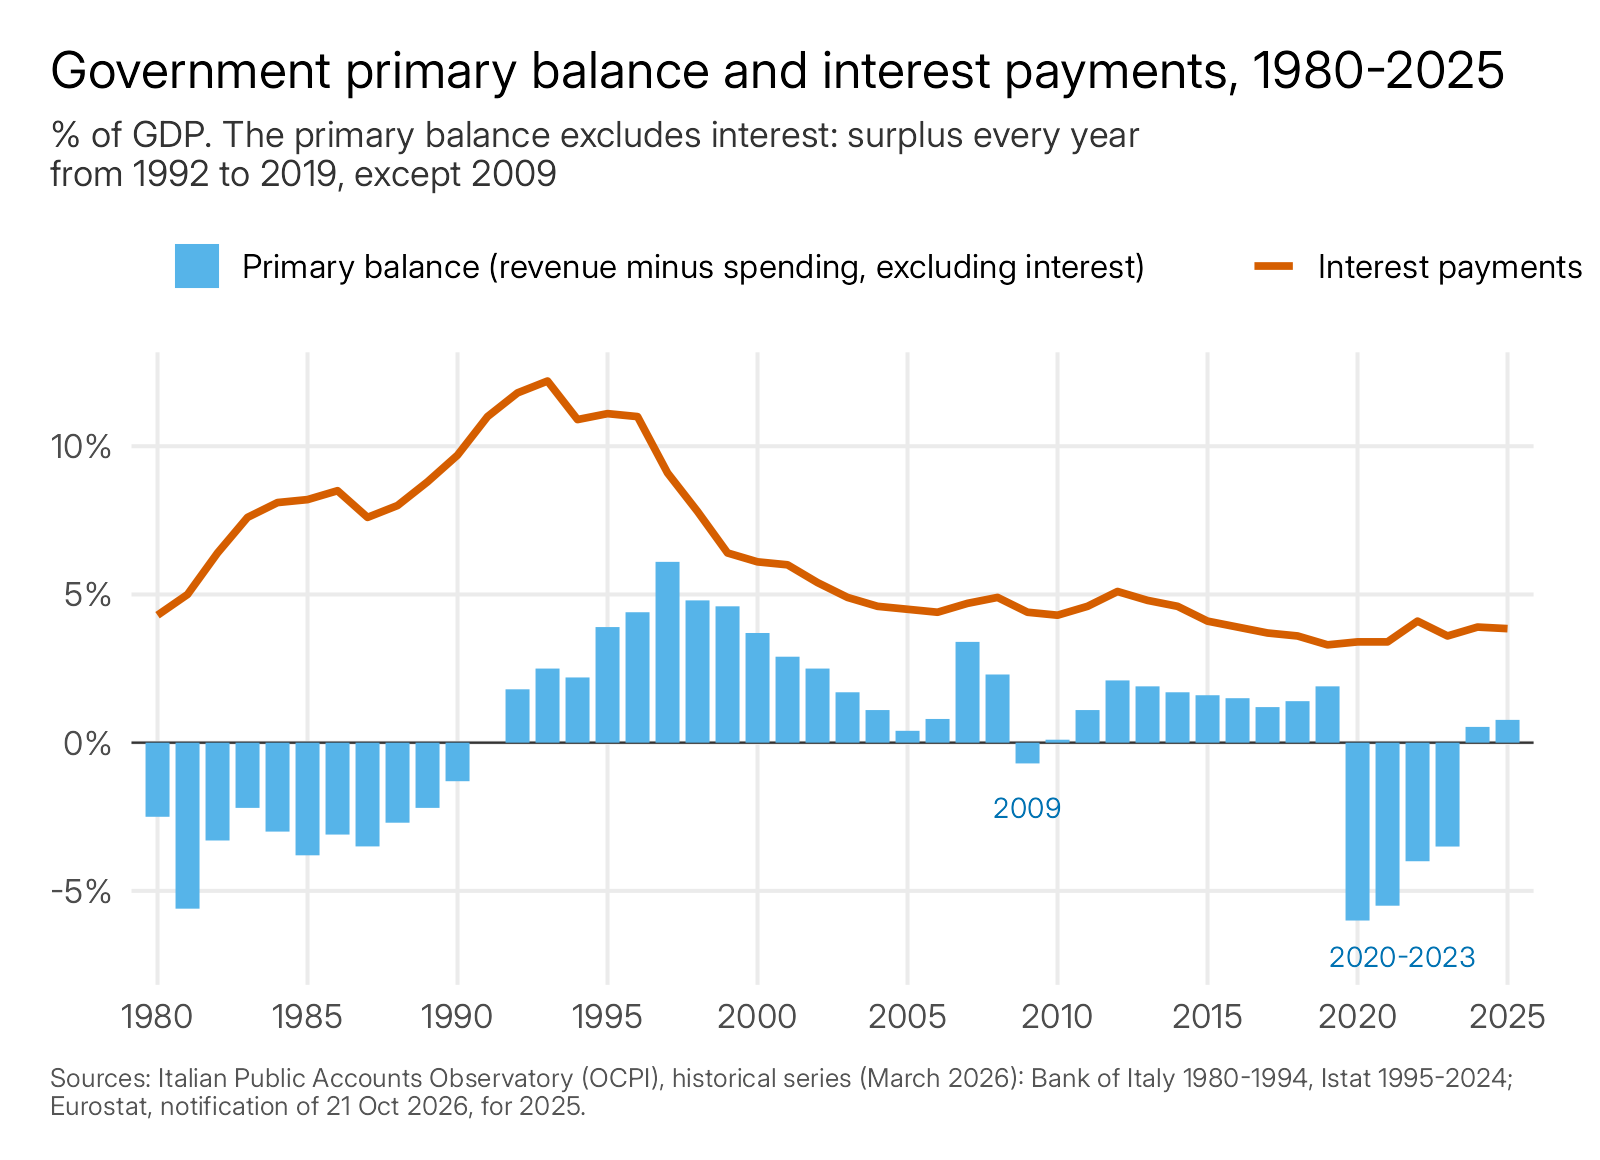
The article title “Italy's Public Debt, Interest and Health Care: A Video's Numbers, Checked” above a chart of Italy's primary balance and interest spending, as a share of GDP, 1980-2025. Sources: Bank of Italy, Istat, Eurostat.

Italy’s Public Debt, Interest and Health Care: A Video’s Numbers, Checked

A video of under three minutes, shared on Instagram, starts from a claim about Italy’s public debt: we were told we lived beyond our means. The guest economist promises to take it apart with numbers.

They are round numbers: billions in debt, interest, hospitals, doctors. But are those figures right?

To find out, I took the claims one by one and compared them with official sources, in eight steps: from the video to the limits of the numbers.

What does the video say?

The video is taken from a piece of a TV broadcast from 2021, “Notizie Oggi Lineasera” on Canale Italia, with the economist Valerio Malvezzi as a guest. It is titled “La grande truffa del debito pubblico” (“The Great Public Debt Scam”). The claims are these, as they read in the video’s subtitles; the video is an edit made by Positano TV:

  • Debt: the public debt accumulated from 1981 to 2020 is “about 2,500 billion” (about €2.5 trillion).
  • Interest: the interest paid over the same period equals the entire debt.
  • Primary surplus: from 2000 to 2020, “except for one year,” the Italian state always took in more than it spent.
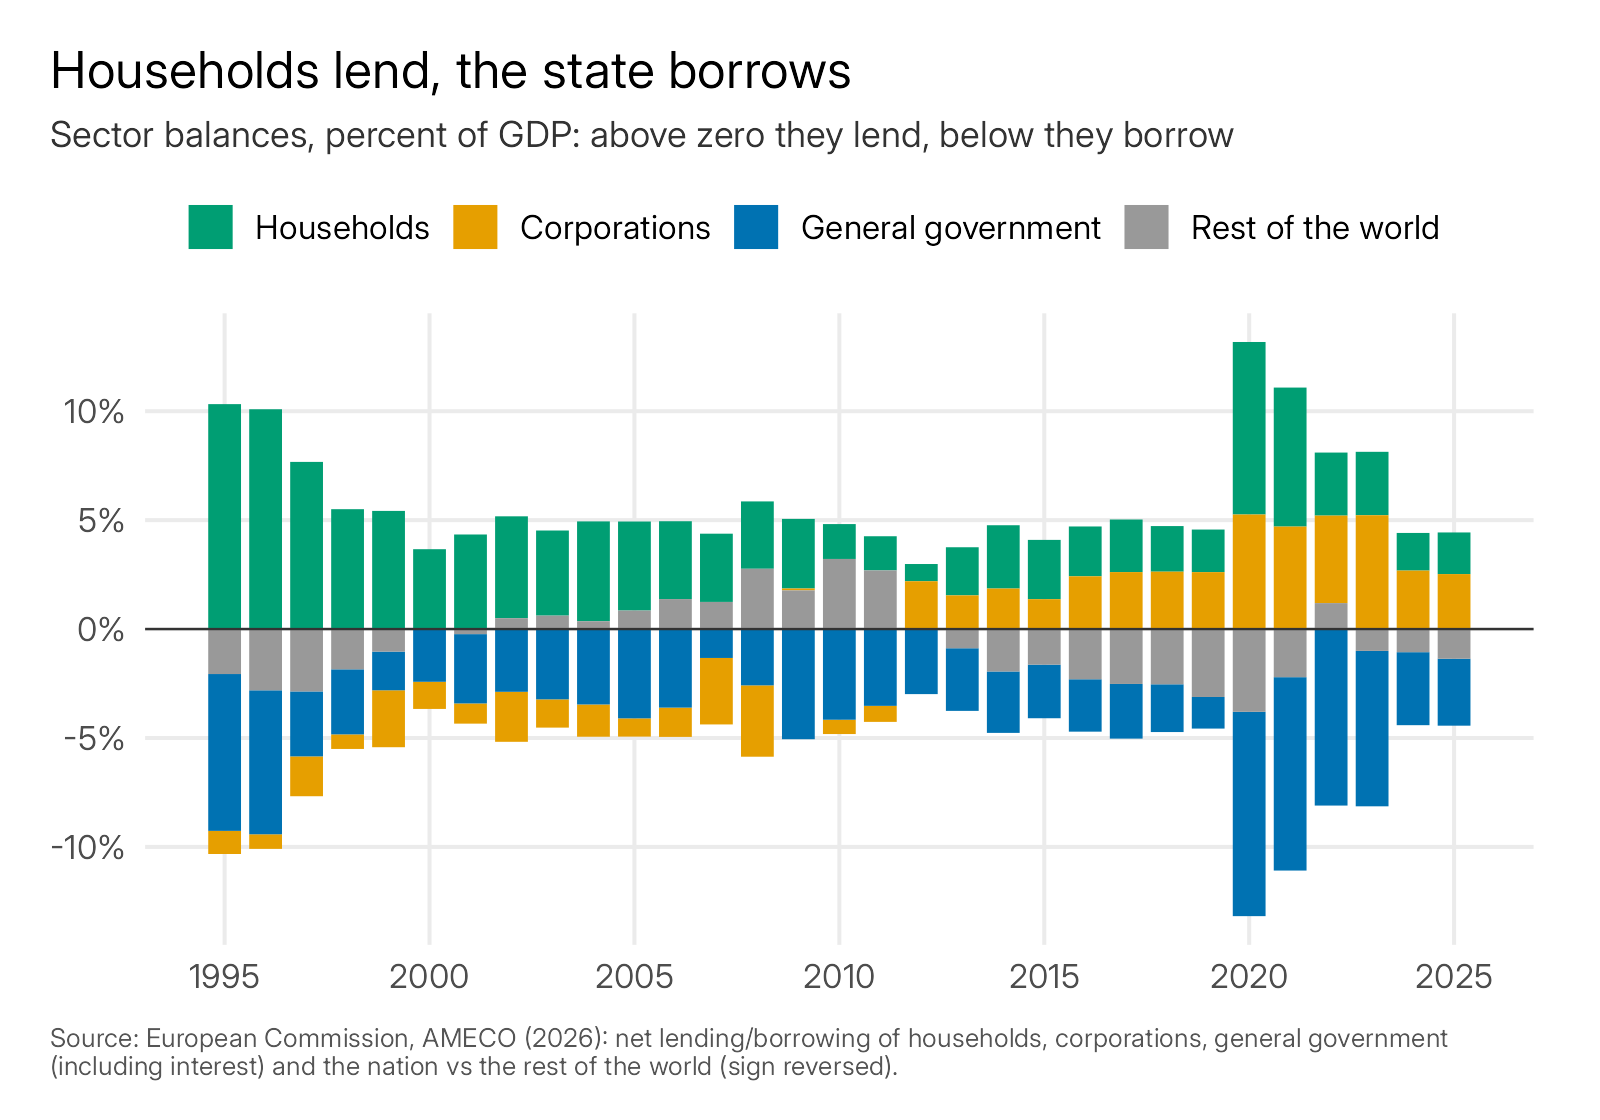
  • Households: according to the “sectoral balances” (the accounts of households, businesses, the state and the rest of the world), if the state is in surplus someone else is in deficit, and “for twenty years we have been losing money in households.”
  • Health care: “in the last 10 years,” 170 hospitals closed, and 10,000 doctors, 6,000 nurses and 48,000 health-care employees lost. The video does not say which years it means.
  • Conclusion: the surplus serves to pay the interest, which in the video goes to the banks, at the expense of doctors, nurses and other services; “it is a political choice.”

Two terms are needed right away. The primary balance is the difference between what the state takes in and what it spends, not counting interest on the debt; if it is positive, it is called a surplus. GDP, gross domestic product, is the value of what Italy produces in a year: it is used to compare figures from different eras.

How much did the debt grow, and how much did interest weigh?

The first number holds up, because “about” says enough. According to the historical series of the Observatory on Italian Public Accounts (Osservatorio sui conti pubblici italiani) of the Università Cattolica, an Italian university, based on Bank of Italy data, the debt grew by 2,460 billion euros (€2.46 trillion) from 1981 to 2020. At the end of 2020 the debt was 154.7% of GDP, according to Eurostat, the statistical office of the European Union. “About 2,500” is a fair approximation.

The second is also essentially true. For the period 1981-2020: the interest paid (2,752 billion) was more than the increase in the debt (2,460). The primary balance, by itself, would have reduced it by 586 billion.

Interest (2,752) minus the primary surplus (586) makes 2,166, but the debt rose by 2,460: about 294 billion are missing. That is what Eurostat calls the “stock-flow adjustment”: the part of the increase in the debt that does not come from the year’s deficit, but from accounting operations, for example when the state holds more cash or lends money to others. The Observatory calculates it precisely as the difference between the increase in the debt and the deficit: 292 billion, and 2,166 plus 292 makes 2,458, against 2,460.

The figure should be read with two caveats:

  • Different years: the sum puts together 1981 lire and 2020 euros. Adjusted for inflation the proportion changes, and the high interest costs of the 1980s and 1990s reflected high inflation.
  • Where the debt starts from: in the 1980s the state also ran a primary deficit, −134 billion from 1981 to 1991. The debt rises from 56% of GDP in 1980 to 98% in 1991, and the interest on that debt did the rest.

Today, according to Eurostat, at the end of 2025 the debt is 3,097 billion euros, 136.7% of GDP. Interest costs 87.2 billion euros a year, 3.8% of GDP.

Did the state take in more than it spent?

For almost thirty years, yes, but not “except for one year.” The years without a surplus are two, not one: 2009 and 2020. Between 2000 and 2020 the primary balance is positive in 19 years out of 21. The video does not say which year is the one left out.

Put better: from 1992 to 2019 Italy had a primary surplus every year except 2009. The cumulative surplus over those years is 820 billion, and the interest paid is 2,223. In other words, interest was far larger than the surplus.

Then the picture changes. The primary balance is negative from 2020 to 2023, the years of the pandemic and the energy-price crisis, and turns positive again in 2024 (+11.7 billion) and in 2025 (+17.4 billion, about +0.7% of GDP).

Chart of Italy's primary balance and interest spending, as a share of GDP, from 1980 to 2025: the primary balance is positive every year from 1992 to 2019 except 2009; interest spending rises to 12.2% in 1993 and falls to 3.8% in 2025.
Primary balance and interest spending of the Italian state, as a share of GDP, 1980-2025. The primary balance excludes interest: it is positive every year from 1992 to 2019, except 2009. Source: Observatory on Italian Public Accounts (based on Bank of Italy and Istat data) and Eurostat.

What happened to health care?

The video does not say which years: I took 2010-2019, the last ten with complete data in the yearbooks. No figure matches those in the video exactly:

  • Hospitals: care institutions (hospitals and clinics, public or private under contract) go from 1,165 in 2010 to 992 in 2019, that is, −173; Quotidiano Sanità, a health-care news site, reports them as “closed.” The count is of inpatient facilities, which in the yearbooks also include the aziende ospedaliere (public hospital organizations): it does not count one hospital at a time. Hospital beds fell by 43,471.
  • Doctors: the salaried doctors of Italy’s National Health Service (Servizio sanitario nazionale) go from 107,448 to 102,316, that is, −5,132. With the contracted doctors, meaning family doctors, pediatricians and out-of-hours doctors, the drop is 9,484, about 10,000.
  • Nurses: from 263,803 to 256,429, that is, −7,374.
  • Employees: the salaried staff of Italy’s National Health Service falls by 42,380 (−6.5%); the drop is over 46,000 counting the contracted doctors. The order of magnitude is the video’s; the number is not.

The period matters. With 2020 included, the staffing figures change a lot: nurses go from −7,374 to +883, because of the hiring in the first year of the pandemic, and salaried doctors to −4,356. The video also speaks of “twenty years” of cuts to hospitals: a comparison over twenty years would need the 2000 yearbook.

After 2019 the facilities are stable and nurses come back above the 2019 level (268,013 in 2022).

The video talks about cuts, and cuts are a matter of spending. According to Eurostat, public spending on health care between 2010 and 2019:

  • In euros: from 119.1 to 121.1 billion, almost flat.
  • Adjusted for inflation: 8% lower.
  • As a share of GDP: from 7.4% to 6.7%.

In 2020, with the pandemic, it rises to 130.3 billion, 7.8% of GDP.

How far are the video’s figures from the data?

The gaps go in both directions: the video understates nurses, hospitals and the years without a surplus, and overstates doctors and employees. Here is the comparison, using only the 2010-2019 period for health care:

WhatVideoDataVideo’s gap
Debt 1981-2020about 2,500 billionincrease 2,460; at the end of 2020, 2,578+2% on the increase; −3% on the debt at the end of 2020
Years without a primary surplus, 2000-202012 (2009 and 2020)−1 year
Hospitals (care institutions)170 fewer173 fewer−2%
Doctors10,000 fewer9,484 fewer (with contracted doctors); 5,132 (salaried only)+5% (+95% on salaried only)
Nurses6,000 fewer7,374 fewer−19%
Health-care employees48,000 fewer42,380 fewer (46,732 with contracted doctors)+13% (+3% with contracted doctors)

The gaps are the difference between the video’s figure and the data, divided by the data, and are rounded.

What are sectoral balances, and what do they say about households?

The economy can be divided into four parts: households, businesses, the state (“general government” in the charts) and the rest of the world. Each one’s financial balance is the difference between what it takes in and what it spends. Added together, the four balances come to zero every year. It is an accounting identity, that is, an equation that always balances, by the way it is built; according to AMECO data, the European Commission’s economic database, it holds from 1995 to 2025 with no discrepancies.

The video, on this point, is right: if one part is in surplus, another is in deficit.

But what enters the identity is the total balance of the state, interest included, not the primary balance. The primary balance says the state took in more than it spent; the total balance is negative every year: overall, the state spent more than it took in. They are two different measures.

Balance, % of GDP2000201920202025
State (general government), interest included−2.4−1.5−9.4−3.1
Households, with nonprofit institutions+3.7+2.0+7.9+1.9

So if the state overall spends more than it takes in, someone else must be in surplus, and households are, every year: their financial balance, which is what the identity measures, is positive every year from 1995 to 2025. It was +10.3% of GDP in 1995. Other things, such as incomes or purchasing power, the financial balance does not measure.

Bars showing the financial balances of households, businesses, general government and the rest of the world in Italy, as a share of GDP, from 1995 to 2025: households are above zero every year, general government below zero.
Financial balances of households, businesses, general government and the rest of the world, as a share of GDP, 1995-2025. Source: European Commission, AMECO (2025 data provisional).

Do the numbers show that the surplus was used to pay interest at the expense of health care?

The data show four true things in the same years:

  • Primary surplus: from 1992 to 2019, almost every year.
  • Interest: higher than the surplus, so the debt rises.
  • Facilities and staff: in 2010-2019, fewer facilities, fewer hospital beds and fewer staff in health care.
  • Health spending: almost flat in euros, down adjusted for inflation and as a share of GDP.

That the reduction in facilities and staff was decided in order to pay the interest, however, is a political claim. The numbers do not prove it, and do not rule it out: they say that things happened in the same years, not that one caused the other.

Lower spending is compatible with the video’s claim, but also with other explanations: regional deficit-reduction plans (the plans under which regions with deficits in their health-care accounts must put them back in order), the European rules on the deficit, or the reorganization of the hospital network. They remain associations, not proof. In the video it is the guest economist’s claim.

What can’t the numbers say?

Three limits, each tied to the data. Debt, interest and balances are in nominal euros, not adjusted for inflation, so adding up different decades is an approximation: the charts use the percentage of GDP. For health care, the 2010 and 2019 figures come from a secondary source, a news site that compares the yearbooks, and the counts of institutions are of inpatient facilities, not of hospitals one by one. The 2025 data are not yet final.

The rest is not a question of numbers. The video also says that it is the banks that collect the interest: the data in this check do not say who holds the debt. And whether the reduction in facilities and staff was a right or wrong choice, and whether it could have been avoided, is a political judgment: the numbers inform it but do not settle it.

All that remains is to see, in the years ahead, whether the primary surplus of 2024 and 2025 becomes a habit again.

Frequently asked questions

Has Italy’s public debt really grown by about 2,500 billion euros between 1981 and 2020?

Essentially, yes. According to the Observatory on Italian Public Accounts, based on Bank of Italy data, the increase is 2,460 billion euros, from 116.7 to 2,576.6; according to Eurostat the debt at the end of 2020 was 2,578 billion, 154.7% of GDP. At the end of 2025 it is 3,097 billion, 136.7%.

Is the interest paid equal to the entire debt?

Yes, and in fact it was more. From 1981 to 2020 the interest paid was 2,752 billion, against an increase in the debt of 2,460. The sum, however, puts together 1981 lire and 2020 euros: adjusted for inflation the proportion is different.

Did Italy have a primary surplus every year from 2000 to 2020, except one?

No, the negative years are two, 2009 and 2020. The primary surplus is there every year from 1992 to 2019, except 2009. After four negative years, from 2020 to 2023, it turns positive in 2024 and 2025. The video does not say which year is the one left out.

How many hospitals, doctors and nurses were lost in ten years, and how much did spending fall?

The video’s figures are close but not equal, and the video does not say which years it means. Between 2010 and 2019, according to the yearbooks of the Ministry of Health, care institutions fall by 173, salaried doctors by 5,132, nurses by 7,374 and salaried staff by 42,380. Public spending on health care goes from 119.1 to 121.1 billion, 8% lower adjusted for inflation.

Have Italian households been losing money for twenty years?

The households’ financial balance is positive every year from 1995 to 2025. According to AMECO data, they set aside more than they borrow. The state, interest included, has always been in deficit. The financial balance counts only what is lent and what is borrowed: it does not measure income or purchasing power.

More number checks

Other articles on this blog that check numbers against official sources:

Download the data and the code

I put the data and the code with which I redid the calculations into a zip file, so that anyone who wants to can repeat the analyses. Inside are the data from Eurostat (debt, deficit and interest since 1995; public health spending), from AMECO (sectoral balances) and from the health-care yearbooks, in CSV files, that is, plain-text tables; the scripts that download the sources, redo the calculations and draw the two charts, written in R, a language for data analysis; and a file of instructions. The historical series of the Observatory on Italian Public Accounts, which covers the decades 1980-2025, is not in the file: the script downloads it from the Observatory’s website. Download the data and code for the analysis (zip): 16 KB (16,050 bytes), file dated November 2, 2026, SHA-256 b4817facb34417c9af22b250338a1ed936236cb2519c557baf2471c43b1db20d. The data come from the sources listed below.

Method note (for those who want to check the math)

Debt, interest and the primary balance come from the Serie storiche di finanza pubblica (historical series of public finance) of the Observatory on Italian Public Accounts (Università Cattolica), March 2026 file: the data are from the Bank of Italy for 1980-1994 and from Istat, Italy’s national statistics office, from 1995. At the end of 1980 the debt was 116.7 billion euros and at the end of 2020 2,576.6 (Observatory); Eurostat gives 2,578 billion at the end of 2020. Eurostat (table gov_10dd_edpt1, notification of October 21, 2026) gives 2020 and 2025 and a check: for 2019, 2020 and 2024 the difference with the Observatory is under 2 billion. AMECO, the European Commission’s database, gives the sectoral balances. Health spending is the “Health” item of the classification of the functions of government (COFOG 07) of Eurostat; adjusted for inflation means at 2010 prices, with the GDP deflator.

The cumulative primary balance 1981-2020 is +586 billion; the cumulative interest 1981-2020 is 2,752 billion; the stock-flow adjustment is +292.4 billion (item L of the Observatory). According to Eurostat it includes the cash held by the Treasury, loans, equity holdings (net of privatizations), exchange rates and statistical discrepancies; the Observatory calculates it as the difference between the increase in the debt and the deficit (item L = change in debt plus net borrowing): it does not measure the individual items. The calculation, 2,752 minus 586 plus 292, makes about 2,458 against an increase of 2,460, and the remainder, 1.4 billion, is due to the rounding of the series as a percentage of GDP. For 1981-2025 interest is 3,147 billion, against an increase in the debt of 2,980.

For health care, the 2010 and 2019 figures come from the comparison of the statistical yearbooks of the Ministry of Health (the annual collections of data) published by Quotidiano Sanità; those for 2020 and 2022 from the yearbooks themselves. For nurses, in the yearbooks (2010, 2019, 2020 and 2022) the drop between 2010 and 2019 is 7,374, and with 2020 it disappears. After 2019: inpatient facilities stable between 2016 and 2022; salaried doctors 101,827 and employees 625,282 in 2022. The Conto annuale (annual accounts) of the State General Accounting Office, which shows the data only through an interactive application, is left out of this comparison.

The video’s quotations are read from the subtitles burned into the edit, one frame per second: the audio was not transcribed. Quotations from Italian-language sources are my translations.

Sources

Accessed November 2, 2026. I mark the type of each source: primary (whoever produces the data), derived (calculated from primary data), secondary. Titles of Italian sources are in the original, with an English translation in brackets.

  1. Osservatorio sui conti pubblici italiani (Università Cattolica), Serie storiche di finanza pubblica [“Historical series of public finance”], March 2026 file (debt, interest, primary balance, stock-flow adjustment; Bank of Italy and Istat data). Primary; derived from primary data. https://osservatoriocpi.unicatt.it/content/dam/siti-web/ricerca/osservatorio_cpi/risorse/ocpi-OCPI%20-%20Serie%20Storiche%20marzo%202026.xlsx (page: https://osservatoriocpi.unicatt.it/risorse/serie-storiche.html)
  2. Eurostat, government debt, deficit and interest (gov_10dd_edpt1), notification of October 21, 2026 (2020, 2025 and check). Primary. https://ec.europa.eu/eurostat/databrowser/view/gov_10dd_edpt1/default/table
  3. European Commission, AMECO, sectoral balances (households, businesses, general government, rest of the world), 2026 (2025 data provisional). Primary. https://ec.europa.eu/economy_finance/db_indicators/ameco/documents/ameco16.zip (page: https://economy-finance.ec.europa.eu/economic-research-and-databases/economic-databases/ameco-database_en)
  4. Ministero della Salute, Annuario statistico del Servizio sanitario nazionale [“Statistical yearbook of the National Health Service”], 2020 and 2022 editions. Primary. https://www.quotidianosanita.it/allegati/allegato1658825757.pdf (2020) and https://www.quotidianosanita.it/allegati/allegato1712573646.pdf (2022)
  5. Quotidiano Sanità, comparison of the 2010 and 2019 yearbooks (care institutions, doctors, nurses, staff). Secondary. https://www.quotidianosanita.it/studi-e-analisi/in-anni-chiusi-ospedali-personale-ridotto-di-mila-unit-scarsi-progressi-sull-assistenza-territoriale-e-sempre-pi-spazio-al-privato-ecco-com-arrivato-il-ssn-di-fronte-al-covid/
  6. Eurostat, general government expenditure by function (gov_10a_exp, COFOG 07 “Health”), updated October 21, 2026. Primary. https://ec.europa.eu/eurostat/databrowser/view/gov_10a_exp/default/table
  7. Eurostat, Stock-flow adjustment note, October 2018. Primary. https://ec.europa.eu/eurostat/documents/4187653/9329991/STOCK-FLOW-2018-OCT.pdf/618b019d-c80a-43dc-a4d6-a58103d402ca
  8. Positano TV, reel “La grande truffa del debito pubblico” (“The Great Public Debt Scam”), an edit of a piece of “Notizie Oggi Lineasera,” Canale Italia, 2021, with the economist Valerio Malvezzi. Subject of the check. https://www.instagram.com/reel/DfO5H2mteBg/
Bar chart on a dark background with the title “Italy's inflation at 5.4%: what costs more in the shopping cart”. Change in prices in October 2026 compared with a year earlier: general index +5.4%, shopping cart +2.5%. Source: Istat, provisional data.

Italy’s Inflation at 5.4%: What Costs More in the Shopping Cart

In October, inflation stood at 5.4%, according to Istat, Italy’s national statistics office: prices are 5.4% higher than a year earlier. The data are provisional, and Istat writes that inflation is back at the level of August 2023.

It is the number that ends up in the headlines. But in the shopping cart, at the supermarket, what has really gone up?

To answer, I have lined up six things: what the 5.4% measures, what has gone up on the dinner table, what is not rising, why prices are rising, whether vegetables explain inflation, and what is still not known.

What does the 5.4% measure?

The general index measures the price of everything we buy: groceries, utility bills, gasoline, rent, travel, restaurants. Each item weighs as much as we spend on it.

The “shopping cart” is only what you buy at the supermarket: food, detergents and household products, soap and personal-care products. It is about one-fifth of household spending. Utility bills and gasoline are not in it.

In October, compared with a year earlier, according to Istat:

  • General index: +5.4% (September +4.2%).
  • Energy (utility bills, fuels, heating oil): +31.4%.
  • Shopping cart: +2.5% (September +1.5%).

Of the 5.4 percentage points of inflation, about 3 come from energy, which is more than half. The calculation is in the methodology note. The shopping cart rose by less than half as much as the general index. I wrote about utility bills in “But Why Do We Italians Pay So Much for Energy?”: here the focus is groceries.

Line chart of annual inflation in Italy from January to October 2026: energy rises to +31.4%, the general index to +5.4%, the shopping cart to +2.5%.
Annual inflation, January-October 2026: general index, shopping cart and energy. Source: Istat, consumer prices (NIC), provisional data for October 2026.

What has gone up on the dinner table?

Four products that people buy often and that are rising faster than the shopping cart, compared with October 2025 (Istat, database, provisional data):

  • Fruiting vegetables: +30.9% (tomatoes, peppers, eggplants, zucchini and the like).
  • Lettuce and other leafy greens: +13.0%.
  • Eggs: +7.3%.
  • Fresh meat: +4.2%.

Vegetables have only just taken off. Fruiting vegetables were at +16.3% in September and are at +30.9% in October. Eggs have been stable since the start of the year, between +7.3% and +8.8%; meat is slowing, from +6.7% in January to +4.2%.

A year ago, fruiting vegetables had fallen 10.2%: compared with two years ago, the increase is 17.5%. Jumps like this have happened before: in October 2022 they were at +30.1%.

Fresh legumes (+11.7%) and potatoes (+7.2%) are also rising; dried legumes hardly move (+0.6%). Berries are at +29.3%, but they weigh little, about one-thousandth of spending.

On November 1, ANSA, Italy’s leading news agency, ran the headline “zucchini +31% in October,” citing Assoutenti, a consumer association, which adds: “Italy is quickly returning to the levels of the 2022 crisis.”

I checked the Istat data: that +31% is the entire category of fruiting vegetables (tomatoes, zucchini, peppers, eggplants and the like), not zucchini alone. In September, according to Istat, tomatoes were at +19.3% and zucchini at +12.5%; the October detail will come out with the final data.

Horizontal bars of the annual price change in October 2026: fruiting vegetables +30.9%, berries +29.3%, lettuce +13.0%, eggs +7.3%, fresh meat +4.2%, shopping cart +2.5%, bread +1.2%, coffee 0.0%, olive oil −5.9%, butter −14.1%.
Annual change in selected food products, October 2026, and in the shopping cart. Source: Istat, database, provisional data.

What is not rising?

Not everything goes up. Compared with a year ago:

  • Butter: −14.1%.
  • Olive and seed oils: −5.9%.
  • Coffee: 0.0%. In January it was up 15.9%: the price increase has stopped.
  • Bread and baked goods: +1.2%, less than the shopping cart.

In autumn, the cart rises because of fresh food and not packaged products. Unprocessed foods, meaning fresh fruit, vegetables, meat and fish, are at +7.5%. Processed ones, such as pasta, milk, cheese and cured meats, are at −0.2%.

Why are prices rising?

There is more than one cause: energy, the heat and a comparison with a year of low prices are facts; the war’s effect on food prices and the truckers’ strike are claims made by associations.

The war in the Middle East, for electricity and gas. Istat writes that the acceleration in inflation reflects mainly the increase in energy goods, from +22.6% to +31.4%, “still influenced by the international geopolitical situation.” The link runs through three things:

  • The Strait of Hormuz: the sea passage through which about one-fifth of the world’s liquefied natural gas (LNG) passes, mostly from Qatar, was closed from February 28, the EIA, the U.S. Energy Information Administration, wrote on April 28. LNG is gas cooled until it becomes liquid, so that it can travel by ship.
  • Qatar: according to ACER, the European agency of energy regulators, the strait remained largely blocked during the summer, and no significant volumes of Qatari LNG reached Europe.
  • Storage: the gas reserves held in storage facilities: according to ACER they were at 28% of capacity at the end of winter and refilled slowly, reaching 75% on October 21.

Gas and electricity on the regulated-price service (the “tutelato” market) are up, according to Istat, by 56.8% and 60.2%.

For groceries, according to ANSA, Assoutenti links the war to the price increases: “There is no sector that is not feeling the effects of the war,” says its president, Gabriele Melluso. For vegetables, Assoutenti offers no data on this link, and Istat names no causes for individual products.

Diesel and fertilizers. For farmers they cost much more: fuels +53.3% and fertilizers +13.4% in a year, according to Ismea, the institute for agricultural market services; diesel for transport +37.7%, according to Istat (consumer price). But in the prices of packaged food they do not show up yet (−0.2%).

In the 2022 crisis, energy price increases reached food prices after about 11 months. That is a single episode, not a forecast. The Unione nazionale consumatori, another consumer association, sees a first sign in processed products, +0.5% compared with September. Christine Lagarde, president of the European Central Bank (ECB), told the European Parliament on June 22, speaking about food prices: “we are likely to see that in the course of 2027 more than in the course of 2026.”

Heat and low prices a year ago. On the heat, there are three voices:

  • Coldiretti, which represents farmers: the summer caused damage of more than €3 billion (first estimate, August 11).
  • Cia, an Italian farmers’ association (not the U.S. agency): yields were estimated in September at about 15% below the average of the last five years.
  • CNR, Italy’s National Research Council: it was the hottest summer since 1950.

In addition, in October 2025 fresh vegetables had fallen 6.4%, according to Istat: the comparison starts from a low level. At the producer level, according to Ismea, tomatoes, peppers and eggplants cost much more than a year ago; zucchini do not (0.0%).

The truckers’ strike. Starting October 16, with stoppages declared through the 20th, truckers and farmers in southern Italy blocked roads over the cost of fuel, writes L’Espresso; the market in Vittoria, in Sicily, stayed empty from the 16th, writes Il Post. The Unione nazionale consumatori ties it to the rise in citrus prices; for October’s vegetables, Istat does not say so.

What about U.S. natural gas? It is a fact that the United States supplies about 30% of the gas the European Union imports, according to ACER, mostly as LNG, sold at European market prices. Euronews, reporting on a study by the IEEFA, a research institute on energy economics and finance, writes that bringing it here generally costs more than pipeline gas, because of liquefaction, shipping and regasification. To explain the autumn increase, ACER points to something else: Qatari LNG almost absent from Europe in the summer, low storage, and the heat, which led to more gas being used to produce electricity.

Do vegetables explain inflation?

No. Four of the biggest increases (fruiting vegetables, berries, leafy greens and eggs) together account for about 0.3 points of the 5.4. Energy accounts for more than 3.

Fresh meat rises “only” 4.2%, but it accounts for 0.10 percentage points of the 5.4, more than half of 0.17, the figure for fruiting vegetables, because much more of it is bought. Vegetables make the news; the weight in the household budget is something else.

What is still not known?

The October data are provisional. Istat publishes the final data on November 17, and the figures may change by a few tenths.

The detail for each individual vegetable, for October, will come out only then, and it will also say whether the vegetable jump recedes.

All that remains is to see, on November 17, what the final data say.

Frequently asked questions

What is the 5.4% everyone is talking about?

It is the change in consumer prices in October 2026 compared with October 2025, according to Istat, and it is a provisional figure. It is the general index: it includes groceries, utility bills, gasoline, rent, travel and restaurants, each with the weight it has in household spending. Istat writes that it is the level of August 2023.

How much have prices risen in the shopping cart?

The shopping cart rose 2.5% in October 2026 compared with a year earlier (September +1.5%), according to Istat. It includes food, household products and personal-care products. That is less than half of the general index, +5.4%, because energy weighs on the latter: utility bills, fuels and heating oil, at +31.4%.

Which products that people buy often have gone up the most?

According to Istat, in October 2026 compared with a year earlier: fruiting vegetables +30.9%, lettuce and other leafy greens +13.0%, eggs +7.3%, fresh meat +4.2%. Butter (−14.1%) and olive and seed oils (−5.9%) are falling. The data are provisional: the final ones come out on November 17.

Do vegetables explain inflation?

No. Four of the biggest increases (fruiting vegetables, berries, leafy greens and eggs) together account for about 0.3 points of the 5.4. Energy accounts for more than 3. The calculation is each item’s weight in household spending, according to Istat, multiplied by how much it rises.

When do the final data come out?

Istat publishes the final data on November 17, 2026. The October figures are provisional and may change by a few tenths. The detail for each individual vegetable will come out only then.

Methodology note (for those who want to check the math)

The index is the NIC, Italy’s consumer price index for the whole population, calculated by Istat on a 2025 base. For U.S. readers: Istat is Italy’s national statistics office, and the NIC is the Italian counterpart of the CPI; it is not the U.S. CPI. According to Istat’s release, the EU-harmonized index of consumer prices (HICP) was +5.6% in October. The changes are against October of the previous year. An item’s contribution to the 5.4% is obtained by multiplying its weight in spending by its change: energy weighs 10.5% of spending and rises 31.4%, and 10.5 times 31.4, divided by 100, makes about 3.3 points of the 5.4, or about 60%. Istat’s exact calculation (figure 4 of its release) gives about 2.8 percentage points for non-regulated energy and 0.4 for regulated energy, or about 3.2.

The 11-month lag between energy and food comes from Istat’s 2021-2023 series: a single episode, in which the war in Ukraine and grain prices were also at work.

Quotations from Italian-language sources are my translations.

Sources

Accessed November 2, 2026. I mark the type of each source: primary (whoever produces the data), derived (calculated from primary data), secondary. Titles of Italian sources are in the original, with an English translation in brackets.

  1. Istat, release “Prezzi al consumo, dati provvisori ottobre 2026” [“Consumer prices, provisional data October 2026”], October 30, 2026. Primary. https://www.istat.it/comunicato-stampa/prezzi-al-consumo-dati-provvisori-ottobre-2026/
  2. Istat, consumer price database (NIC, 2025 base, Ecoicop 2 classification; 2026 weights), accessed November 2, 2026. Primary; derived from primary data. https://esploradati.istat.it/
  3. ANSA, “Assoutenti, la guerra fa schizzare i prezzi, zucchine +31% a ottobre” [“Assoutenti: the war sends prices soaring, zucchini +31% in October”], November 1, 2026, 11:18 a.m. Secondary; Assoutenti is an interested party. https://www.ansa.it/sito/notizie/economia/2026/11/01/assoutenti-la-guerra-fa-schizzare-i-prezzi-zucchine-31-a-ottobre_7b2133da-31b8-4378-9111-9db270ef23d7.html
  4. Ismea, production input price indices, September 2026, and producer prices, fourth week of October 2026. Primary. https://www.ismeamercati.it/flex/cm/pages/ServeBLOB.php/L/IT/IDPagina/4286
  5. ACER, “Key developments in European gas wholesale markets – summer 2026,” October 27, 2026 (Qatar, gas imports from the United States and Russia). Primary. https://www.acer.europa.eu/monitoring/key-developments-european-gas-wholesale-markets-summer-2026
  6. EIA, “International LNG prices rise amid Strait of Hormuz closure,” April 28, 2026. Primary. https://www.eia.gov/todayinenergy/detail.php?id=67604
  7. Il Post, “Perché mancano ortaggi, insalata e pomodori” [“Why vegetables, lettuce and tomatoes are in short supply”], September 23, 2026; article on the Vittoria market, October 21, 2026. Secondary. https://www.ilpost.it/2026/09/23/mancano-ortaggi-insalata-pomodori-perche/
  8. Coldiretti, release on heat damage above €3 billion (first estimate), August 11, 2026, https://www.coldiretti.it/economia/caldo-danni-da-clima-superano-i-3-miliardi-calamita-nei-campi ; Teleborsa, “Caldo: Cia, al settore un conto da oltre 2 miliardi. Rese agricole stimate a -15%” [“Heat: Cia, a bill of over €2 billion for the sector. Yields estimated at -15%”], September 3, 2026, https://www.teleborsa.it/News/2026/09/03/caldo-cia-al-settore-un-conto-da-oltre-2-miliardi-rese-agricole-stimate-a-15percent-187.html ; AGI, “Estate 2026 la più calda dal 1950, temperatura media record di 24,3 °C” [“Summer 2026 the hottest since 1950, record average temperature of 24.3 °C”], September 7, 2026, https://www.agi.it/cronaca/news/2026-09-07/clima-cnr-estate-calda-38923549/ . Secondary; Coldiretti and Cia are interested parties.
  9. L’Espresso, Paolo Tomasi, “Continua la protesta degli autotrasportatori. Nuovi presidi sulle autostrade in tutto il Sud Italia, bloccati i porti in Sicilia” [“The truckers’ protest continues. New pickets on highways across Southern Italy, ports blocked in Sicily”], October 19, 2026, https://lespresso.it/c/attualita/2026/10/19/proteste-autotrasportatori-blocchi-autostradali-sud-italia-campania-calabria-sicilia-basilicata-puglia/65365 . Secondary.
  10. Unione nazionale consumatori, release on October inflation, October 30, 2026. Secondary; the association is an interested party. https://www.consumatori.it/comunicati-stampa/inflazione-16/
  11. Eunews, Emanuele Bonini, “Lagarde: «L’inflazione alimentare si presenterà nel 2027»” [“Lagarde: ‘Food inflation will show up in 2027’”], June 22, 2026 (hearing of the ECB president before the European Parliament’s Committee on Economic and Monetary Affairs), https://www.eunews.it/2026/06/22/lagarde-linflazione-alimentare-si-presentera-nel-2027/ . Secondary. Primary source: ECB, “Monetary Dialogue with Christine Lagarde,” transcript of the hearing, June 22, 2026, p. 12, https://www.ecb.europa.eu/press/key/date/2026/html/ecb.sp260622_annex1~7c2171811a.en.pdf . Primary.
  12. Euronews, Quirino Mealha, “Two-thirds of Europe’s LNG imports to come from the US amid increased reliance,” May 13, 2026, which reports on an IEEFA report. Secondary. https://www.euronews.com/2026/05/13/two-thirds-of-europes-lng-imports-to-come-from-the-us-amid-increased-reliance
Bar chart of TOPS claimed by manufacturers: BrainChip AKD1500 kit 0.8, Hailo-8L 13, Hailo-8 26. Figures use different models and conditions, so they cannot be compared directly. Sources: Electronics For You, CNX Software.

A Raspberry Pi 5 with a “Neuromorphic” Chip for $1,295: What BrainChip Promises and What Is Still Unknown

BrainChip, an AI chip company, launched the AKD1500 kit for the Raspberry Pi 5 on October 29, 2026, according to its press release. The Raspberry Pi 5 is a small single-board computer; the kit pairs it with a BrainChip board carrying a chip that the company calls “neuromorphic,” that is, inspired by the brain.

The kit is meant, according to BrainChip, for engineers, hobbyists and product teams who already work with the Raspberry Pi. They want to develop artificial intelligence programs that run on the device itself, without an online service: edge AI.

According to BrainChip’s specifications as reported by Electronics For You, an electronics magazine, the board delivers up to 800 GOPS, that is, 800 billion operations per second, and draws less than 300 milliwatts, that is, less than a third of a watt. The price, according to CNX Software, an electronics news site, is $1,295.

What exactly do you get for that $1,295, and how much of what is promised has been measured by someone who does not sell it?

To answer, I lined up five things: what is in the kit, what BrainChip claims, what you can do with that much power, what it costs and what is still unknown.

What Is in the Kit?

The kit, CNX Software writes, includes an 8 GB Raspberry Pi 5, the official M.2 HAT+ expansion board and the AKD1500 board in a metal case, with a 32 GB SD card already loaded with the software.

The SD card holds Ubuntu Server 20.04 LTS (marked “TBC,” to be confirmed), Python 3.7 and MetaTF. Ubuntu Server is a Linux operating system for servers, Python is a programming language and MetaTF is BrainChip’s development software.

The M.2 HAT+ is the board that adds an M.2 slot to the Pi, the format used by fast expansion cards, such as solid-state drives. The AKD1500 board sits in that slot. BrainChip presents it as “event-based.” In general, an event-based chip processes events, that is, only what changes in the data, and not all the data every time.

I used the same M.2 format to boot another mini-computer from a fast drive.

The kit also requires a USB camera, instead of the Raspberry Pi camera module. CNX’s list does not include it, and the page does not say whether it is included.

The demos, CNX writes, open in the browser and all run on the device, without an online service: detecting whether people are present, and recognizing objects and faces. How the board handles the camera’s images, CNX does not say.

Anyone who already has a Pi 5 with the M.2 HAT+ can add only the production M.2 board, BrainChip writes in the press release. The kit, again according to the press release, is available now from BrainChip’s store.

What Does BrainChip Claim?

According to BrainChip’s specifications as reported by Electronics For You, the board delivers up to 800 GOPS, has 1 MB (one megabyte) of memory on the chip and works at clock speeds between 5 and 400 megahertz, the unit that measures how fast a chip runs.

On power consumption the same source gives two values: less than 300 milliwatts, and about 250 milliwatts at 400 megahertz, the highest speed. They do not contradict each other: 250 is a value at a specific speed, and 300 is the stated limit. At what speed the 800 GOPS apply, and under what conditions the 300 milliwatts, the pages do not say.

Electronics For You writes “up to” 800 GOPS and specifies that these are the manufacturer’s specifications, not measurements of a complete Raspberry Pi system, and that real speed and power consumption will depend on the model, resolution, workload and system.

The press release adds three things:

  • Software: MetaTF, the development software, is free and can be downloaded from BrainChip’s Developer Hub.
  • Support: Docker images, that is, preconfigured software, will be included.
  • Learning: the chip can learn new keywords, gestures or objects on the device, without retraining.

What Can You Do with 800 GOPS?

An operation, here, is an addition or a multiplication. You will also see TOPS, which means a trillion operations per second: 800 GOPS is 0.8 TOPS. In AI chips the figure is often a theoretical maximum, and it says little about how fast a real program is.

In theory it is enough to recognize objects in a video at 30 frames per second. To see why, you need to know how many operations a model requires.

MobileNetV2, a lightweight AI model that recognizes what is in an image, requires, according to its authors, 300 million multiply-adds per image: a multiplication followed by an addition counts as two operations, so that is 0.6 billion operations.

With 800 billion operations per second you could process about 1,300 images per second (800 divided by 0.6), in theory.

A model that finds objects in a video, such as YOLOv8n at an image size of 640 pixels, requires 8.7 billion operations per frame, according to Ultralytics’ documentation: 800 divided by 8.7 gives about 90 frames per second, in theory. A video at 30 frames per second would fit with room to spare.

The larger model, YOLOv8s, requires 28.6 billion and would be at the limit. The documentation speaks of “FLOPs”: if they are multiply-adds and not operations, the frames per second are cut in half. The order of magnitude remains a few dozen.

These are theoretical maximums: chip used at 100%, no time to move the data, no work to prepare the input or handle the results. CNX’s demos, with people, objects and faces, are tasks of the same kind, but CNX gives neither frames per second nor power consumption. Which of these models run on the chip, and in which version, the sources do not say.

How far theory is from practice is shown by another manufacturer’s tests. Coral states 4 TOPS for its chip and publishes, for MobileNetV2, a measured time of 2.6 milliseconds: about 385 images per second.

Theory would give about 6,700 (4 trillion divided by 0.6 billion): the measured rate is about 6% of that. The comparison assumes that the model Coral used requires the same operations that the authors of MobileNetV2 indicate.

For BrainChip’s kit, no source publishes a similar measurement.

On boards for the Raspberry Pi, manufacturers state higher figures: 13 TOPS for the AI HAT+ with the Hailo-8L chip and 26 with the Hailo-8 chip, according to CNX Software (October 24, 2024). That is about 16 and 32 times the 800 GOPS. At launch they cost $70 and $110, before taxes and shipping.

These figures are stated for different AI models and under different conditions: they do not say which board is faster in practice, nor how BrainChip would perform on the same tasks.

How Much Does the Kit Cost?

BrainChip’s press release does not give a price. The $1,295 is reported by CNX Software, which links to the kit’s page in BrainChip’s store and compares it with the cost of the parts that, in its estimate, reproduce the kit:

  • Raspberry Pi 5 with 8 GB: $175 list price.
  • M.2 HAT+: $12.
  • AKD1500 M.2 board: $129.
  • Metal case: about $11.
  • 32 GB microSD card: $10-$20.

That comes to about $350, plus taxes and shipping, and about two hours of assembly and software installation. The kit therefore costs more than three times that sum: 1,295 divided by about 350 is about 3.7.

CNX writes that buying the kit may make sense if an hour of your own work is worth more than about $400, and that it is a development kit, not optimized for cost. These are prices in dollars, as in the sources.

For the AKD1500 board alone, the sources give two figures that do not necessarily concern the same model: $129 for the M.2 board in CNX’s list, which does not say where its prices come from, and boards that “start at $99” according to Electronics For You, on September 22, which speaks of AKD1500 boards in general (M.2, PCIe and other variants) and adds that the final cost depends on the variant, shipping, the exchange rate and customs duties.

What Is Still Unknown?

The dates do not match: BrainChip dates the press release October 29, while HPCwire, which republishes it, dates it October 30. It is not a second source: it is the same text.

The performance figures have a single origin, the manufacturer. For now, measurements of the kit by third parties are missing.

When a third-party test comes out, it is worth looking at three things:

  • Real speed: how fast the kit runs real tasks, not the maximum in GOPS.
  • Power consumption: that of the whole system, not just the board.
  • Comparison: with other boards for edge AI.

It remains to be seen whether, and when, someone will measure the kit under a real load.

Sources

Accessed November 2, 2026. I mark the type of each source: primary (who produces the information), secondary (who reports or analyzes it).

  1. BrainChip, press release “BrainChip launches AKD1500 Raspberry Pi 5 Kit giving developers a direct path from prototype to production,” October 29, 2026. Primary (the manufacturer). https://brainchip.com/press/brainchip-launches-akd1500-raspberry-pi-5-kit-giving-developers-a-direct-path-from-prototype-to-production/
  2. CNX Software, “BrainChip AKD1500 Raspberry Pi 5 dev kit enables users to quickly experiment with event-based neuromorphic AI,” November 2, 2026 (the page also shows November 1). Secondary, independent of the manufacturer. https://www.cnx-software.com/2026/11/02/brainchip-akd1500-raspberry-pi-5-dev-kit-enables-users-to-quickly-experiment-with-event-based-neuromorphic-ai/
  3. Electronics For You, “Run your own AI models on BrainChip’s $99 Akida card,” September 22, 2026 (before the kit; it discusses the AKD1500 boards). Secondary. https://www.electronicsforu.com/news/run-your-own-ai-models-on-brainchips-99-akida-card
  4. HPCwire, republication of BrainChip’s press release, October 30, 2026. Not an independent source. https://www.hpcwire.com/off-the-wire/brainchip-launches-akd1500-raspberry-pi-5-kit/
  5. Sandler et al., “MobileNetV2: Inverted Residuals and Linear Bottlenecks,” arXiv 1801.04381 (300 million multiply-adds, 224×224). Primary (the authors of the model). https://arxiv.org/abs/1801.04381
  6. Ultralytics, YOLOv8 documentation, model table (8.7 and 28.6 billion FLOPs at 640 pixels). Primary (on the model). https://docs.ultralytics.com/models/yolov8/
  7. Coral, FAQ (4 TOPS) and benchmarks page. Primary (times measured by the manufacturer). https://coral.ai/docs/edgetpu/faq/ and https://coral.ai/docs/edgetpu/benchmarks/
  8. CNX Software, “Raspberry Pi AI HAT+ features Hailo-8L or Hailo-8 AI accelerator with up to 26 TOPS of performance,” October 24, 2024 (13 and 26 TOPS; $70 and $110). Secondary. https://www.cnx-software.com/2024/10/24/raspberry-pi-ai-hat-plus-features-hailo-8l-or-hailo-8-ai-accelerator-with-up-to-26-tops-of-performance/
Map of Europe colored by household electricity price in the first half of 2026, in euros per kWh: Italy highlighted at 0.31, Germany 0.36 and Ireland 0.39 among the most expensive countries, Hungary 0.11 and Malta 0.13 among the cheapest.

But Why Do We Italians Pay So Much for Energy?

In the first half of 2026, an Italian household paid an average of 0.314 euros for every kilowatt-hour (kWh, the unit used to measure electricity), taxes included, for consumption between 2,500 and 4,999 kWh a year. That is 11% more than the European Union average, 0.283, according to Eurostat, the statistical office of the Union.

Only Ireland, Germany, Belgium and Austria paid more. Compared with France (0.249 euros per kWh) and Spain (0.251), we pay about a quarter more; compared with Germany, which pays 0.362, we do not. Where does the difference come from?

Map of Europe colored by household electricity price in the first half of 2026, in euros per kWh: Italy highlighted at 0.31, Germany 0.36 and Ireland 0.39 among the most expensive countries, Hungary 0.11 and Malta 0.13 among the cheapest.
Average electricity price for households in Europe, first half of 2026, euros per kWh, taxes included (households with consumption of 2,500-4,999 kWh a year). Source: Eurostat.

For businesses the distance is greater: 0.225 euros per kWh without VAT, 25% above the European average. Only Ireland and Cyprus do worse than we do, according to Eurostat.

To answer, I looked at three things: taxes, the wholesale price, and what changes in the countries that pay less.

Taxes Do Not Explain the Gap

The first explanation that comes to mind is taxation. The data say it is not enough: in Italy, taxes and levies make up 25% of the electricity price for households, less than the European average (28.4%).

Even without taxes we remain among the most expensive: seventh out of 39 countries, with 0.236 euros per kWh against about 0.203 for the European average. Part of the bill, however, is not a tax in the strict sense: it is the system charges (oneri di sistema), the items that pay, among other things, for renewable incentives and the social bonus. The number I use is the price with all taxes and levies minus the price without, according to Eurostat’s definition (“taxes and levies”).

ARERA, the Italian energy authority, reaches the same conclusion on the comparison with the euro area: the gap comes almost entirely from the “energy” item, that is, from the price of electricity itself, before grid costs, charges and taxes. On the evolution in 2025 it adds something else: the final price for households fell by 1.6%, but charges and the tax component “neutralize” the possible savings.

An example of how a bill is divided. For a vulnerable customer on the regulated “maggior tutela” service, the service with prices set by ARERA, every 100 euros of the bill are divided like this from October 2026:

  • Energy: 63.7 euros
  • Grid: 14.2 euros
  • System charges: 7.6 euros
  • Retail (sales costs): 4.9 euros
  • Taxes: 9.6 euros

This is the breakdown after the quarter’s increase, and it is not everyone’s bill: it applies to vulnerable customers on the regulated service, about 3 million, and the open market (mercato libero) has different prices.

Bar chart by country of household electricity price, first half of 2026, euros per kWh, split into price without taxes and taxes and charges. Italy 0.314, taxes 25% of the price; EU average 0.283 (28%); Ireland 0.387, Germany 0.362.
Share of taxes and charges in the electricity price for households, first half of 2026. Source: Eurostat.

Gas and the Wholesale Price

What remains is the price of electricity before it reaches the bill: the wholesale price, the one at which suppliers buy it. The reference price is formed every day in the Day-Ahead Market, where electricity for the 24 hours of the next day is bought and sold hour by hour or, since October 2025, at fifteen-minute intervals.

Not all electricity goes through here: part is bought with forward contracts. The Ministry of the Environment and Energy Security (MASE) writes, in the National Integrated Energy and Climate Plan (PNIEC) of June 2024, that accepted offers are paid at the “system marginal price” (in Italian, “prezzo marginale di equilibrio”).

In plain words it works like this: power plants offer their energy, from the lowest offer to the highest, until the demand of that hour is covered. The last accepted offer, the highest of those that are needed, sets the price, and all accepted offers receive that price. An invented example, just to understand: if three plants are needed that offer at 30, 60 and 100 euros per megawatt-hour, all three are paid 100.

The mechanism is the same in much of Europe: what changes is which plant is the last one needed.

Why gas in particular? The three plants in the example could be solar, hydro or gas, in any order. The 2024 Plan states that combined-cycle gas plants have higher costs to run than, for example, the nuclear plants in other European countries. With higher costs, their offers are, in general, among the highest: for this reason, when they are needed, they are often the last offer.

The market is divided into zones, portions of the grid with limited exchange capacity, and each zone can have its own price. Until 2024, consumption was billed at the PUN (the national single price, prezzo unico nazionale), an average of the zonal prices. From January 1, 2025, the Italian energy markets operator (Gestore dei mercati energetici, GME) writes, purchases are paid at zonal prices, with a compensating component that realigns the cost with the PUN Index GME: what reaches consumers is, in effect, still the PUN Index. For simplicity I call it the PUN.

In the first half of 2026 the PUN averaged 127.2 euros per MWh (megawatt-hour, a thousand kWh): the highest among the 14 European market zones for which I have open-license data.

To compare it with the bill: 127.2 euros per MWh is about 12.7 euro cents per kWh, that is 0.127 euros per kWh. It is the price at which suppliers buy electricity, a part of the 31.4 euro cents of the bill: the rest includes other energy costs, grid costs, charges, taxes and sales. It is not the breakdown in the ARERA example above, which concerns vulnerable customers after the October increase: other customers and another period.

In Germany it was 98.7, in France 61.8. The gap with the European average is largely here. The figure is a simple average of the hours, from GME and Energy-Charts data.

Bar chart of average wholesale electricity price, January-June 2026, euros per MWh, by zone: Italy (PUN), in orange, is highest at 127; Hungary 118, Germany 99, France lowest at 62.
Average wholesale electricity price, January-June 2026, euros per MWh. Source: GME (Italy, PUN) and Energy-Charts (other zones with open license).

In 2025 as well, ARERA writes, the PUN was the highest among the main European exchanges: it indicates as the cause the strong dependence on gas-fired generation, the first factor in the wholesale price, and writes that prices remain “closely tied” to gas.

Gas really does play a big role: in 2025 Italy produced 47.4% of its electricity with gas. Among the 30 European countries Ember tracks, only Malta (83.1%) and Ireland (48.4%) did more, according to Ember, an energy research center.

The 2024 Plan also speaks of gas as “the main and marginal source for Italy”: marginal here means the plant at the margin, the one that sets the price, not a minor source.

One distinction is needed: one thing is how much electricity comes from gas, another is how often gas sets the price. The price is decided by the last offer that is needed, not by the most widespread technology.

To know how often gas sets the price, there is no single number. GME has an indicator of its own: for combined-cycle gas plants (plants that use the heat of combustion twice) it gives 61.4% in 2024 and 52.5% in 2025, that is, around half or a little more. The details of the method are in the note below.

The European Environment Agency (EEA) uses another method, and for the first 16 weeks of 2026 it gives 66% of the hours in Italy and 9% in Spain. The EEA writes that in those hours gas set the price, but its measure is a comparison: it counts the hours in which the day-ahead price is at least equal to the cost of producing with a gas plant.

The measures are different, over different periods.

Only the EEA’s allows the comparison with Spain, because it has the same method and the same period: in Italy the price reached the cost of gas in about two hours out of three, in Spain in 9% of the hours.

The two measures give a little more than half (GME, 2025) and two thirds (EEA, first 16 weeks of 2026): they are not the same number and should not be added together. Gas is not the only explanation I found in the official documents: ARERA examined another one, which I cover in a later article.

France, Spain, Germany

France produced 68.8% of its electricity with nuclear power in 2025, according to Ember, and paid on average about half the Italian price on the wholesale market.

Spain used gas for 22% of its electricity, against 47% for Italy.

Its 2025 wholesale price was about 67 euros per MWh, against 122 for Italy in the same Ember series.

These are comparisons, not proof: among these countries climate, hydropower, grid costs and regulated rates also differ, factors that the data do not measure.

Germany has a wholesale price lower than ours, 98.7 euros per MWh against 127.2, but higher bills: 0.362 euros per kWh. This means that other items weigh on the German bill.

On February 17, 2026, the German federal government described several measures as relief from energy prices, two of them on parts of the bill other than energy. Transmission grid fees are the part that pays for the power lines: in 2026 the government subsidizes them with 6.5 billion euros. The renewables levy is the item that finances the incentives: the state has already taken it on, 17 billion euros. These are two items that weigh on the German bill, alongside energy, and that the state says it pays in part.

The Title Only Partly Holds Up

The title of this article only partly holds up: we rank fifth, not first, for households, and Germany pays more.

It holds for electricity, not for all energy: for household gas, again according to Eurostat, we rank tenth, close to the European average (0.114 euros per kWh against 0.110), although in the second half of 2025 we were third.

And even for electricity the gap with the European average changes from one half-year to the next: it was 2% in the second half of 2025 and about 31% in the second half of 2022.

From August, Prices Rise Everywhere

For Italy, the Council of Ministers postponed on October 28 its examination of a decree-law on the cost of electricity and gas, which I cover here: the Council of Ministers press release no. 195 and the MASE’s 14 billion.

The February energy bills decree (Decree-Law 21/2026, converted into Law 49/2026) contains measures to reduce the cost of energy for households and businesses.

These comparisons have a date. Since August 2026 the wholesale price has risen in all 16 European countries Ember tracks, by a median of 54% between July and October.

In Italy it went from 157 euros per MWh in July to 228 in October, up to the 29th: 45% more, one of the smallest increases in percentage terms. But the October price is the third highest of the 16, after Hungary and Bulgaria.

France, Spain and Germany, which in July were between 97 and 107 euros, rose more and reached around 160. In France the rise was 66%: the French price, which in 2025 and in the first half of 2026 was about half ours, has been 70% of ours since August.

In euros the gap with France remains: 62 per MWh on average from August to October, against 58.5 in 2025. In percentage terms, therefore, the distance has narrowed; in euros it has not.

The rise follows the price of gas. From July to September wholesale gas rose by about 22 euros per megawatt-hour (ARERA, World Bank), and the price of electricity by 38 to 51 euros in Italy, Germany, Spain and France. For every extra euro on gas, Italian electricity gains about 1.8: that is what one expects from a gas plant that sets the price.

Gas rises with the Hormuz crisis. Since February 28, with the attack by the United States and Israel on Iran (Al Jazeera), the strait has been effectively closed (EIA). In March Italian gas rises by almost 50%. With the pause in fighting in April it stops rising: it stays between 46 and 47 euros per megawatt-hour until June, when the United States and Iran sign a preliminary agreement. It starts rising again in July, when the truce collapses and Qatari gas barely reaches Europe (ACER).

Heat and drought also weighed: less water and less nuclear power, more gas plants, with gas-fired generation in the Union up 20% in August (ACER). And countries with a lot of nuclear or hydropower rise too, such as France and Spain: in European markets, which are linked to one another, when gas moves a lot the price follows it there as well.

It is a strong and coherent association, not a measurement: ACER writes that higher gas costs put “substantial upward pressure” on electricity prices, but it does not say how much of the rise depends on Hormuz and how much on the rest. The MASE writes on October 16 that the aim of its new decree is to limit the effects of the rise in the price of gas on the cost of electricity.

Line chart of average monthly wholesale electricity price, January 2025 to October 2026, euros per MWh: Italy, in orange, rises to 228 in October; Poland 165, Germany 163, Spain 162, France 161, Denmark 152.
Average monthly wholesale electricity price, January 2025-October 2026 (October up to the 29th; July-October 2026 highlighted), euros per MWh. Source: Ember; Italy consistent with the GME PUN through September.

What Electricity Is Made From

Among the 27 countries of the Union, the wholesale price tends to be higher where more fossil fuels (gas, coal, oil) are used, but the household bill is not necessarily higher: no clear link emerges. The energy sources weigh on the wholesale price; the bill also depends on other things, such as taxes, grid costs and regulated rates.

Scatter plot of EU countries: fossil share of electricity production in 2025 and household electricity price, first half of 2026. The points show a weak link (Spearman 0.11). Italy at 0.31 euros per kWh.
Share of fossil fuels in electricity production 2025 and household electricity price, first half of 2026, 27 countries of the Union. Source: Ember, Eurostat.

The bill, then, lies more in the energy we buy than in the taxes we pay on top of it, and gas, according to ARERA, is the first factor in the wholesale price.

But if gas matters so much, why is it precisely in the evening that Italy runs on gas?

In the Series

This is the first article in the series “But Why Do We Italians Pay So Much for Energy?” The answer to the question above is in the next article. After that: who pays for the transition, and what is still missing for wind, storage and rooftop solar.

Method Note (for Those Who Want to Check the Numbers)

Eurostat prices are national averages for standard consumption bands (households 2,500-4,999 kWh a year, businesses 500-1,999 MWh a year), not the average bill: fixed or variable contracts and bonuses are not separated. Switzerland and the United Kingdom are not included; for countries outside the euro, the exchange rate shifts prices. In the wholesale chart I left out the zones with a license that is not open. The wholesale average is simple, not weighted by volume.

Its public definition brings it closer to one built on volumes sold: for this reason it should not be compared with the EEA’s 66%, which counts hours.

Sources

Accessed October 30, 2026. I mark the type of each source: primary (the body that produces the data), analysis (the newsroom on primary data), secondary.

  1. Eurostat, electricity prices for households (nrg_pc_204, band 2,500-4,999 kWh a year), first half of 2026, data updated to October 19, 2026. Primary; newsroom analysis. https://ec.europa.eu/eurostat/api/dissemination/statistics/1.0/data/nrg_pc_204
  2. Eurostat, electricity prices for businesses (nrg_pc_205, band 500-1,999 MWh a year), first half of 2026. Primary; newsroom analysis. https://ec.europa.eu/eurostat/api/dissemination/statistics/1.0/data/nrg_pc_205
  3. ARERA, press release “I numeri dei servizi pubblici” (Annual Report 2025), July 1, 2026. Primary. https://www.arera.it/fileadmin/allegati/com_stampa/26/Comunicato_stampa_ARERA__I_numeri_della_Relazione_Annuale_2025.pdf
  4. ARERA, Annual Report, presentation by the President, July 1, 2026. Primary. https://www.arera.it/fileadmin/allegati/relaz_ann/26/discorso_presidente_DIGITAL.pdf
  5. ARERA, press release “Elettricità maggior tutela +37,3% nel IV trimestre 2026 per i clienti vulnerabili” (electricity, regulated service, +37.3% in the fourth quarter of 2026 for vulnerable customers), September 29, 2026. Primary. https://www.arera.it/fileadmin/allegati/com_stampa/26/Comunicato_stampa_ARERA_aggiornamento_Maggior_Tutela_IV_TRIM_2026.pdf
  6. ARERA, Report 301/2026/I/EFR, August 6, 2026 (gas as the first factor in the PUN). Primary. https://www.arera.it/fileadmin/allegati/docs/26/301-2026-I-efr.pdf
  7. GME, MGP Results, Historical Data, “Anno 2026” file (hourly PUN Index). Primary; newsroom analysis. https://www.mercatoelettrico.org/it-it/Home/Esiti/Elettricita/MGP/Statistiche/DatiStorici
  8. Energy-Charts (Fraunhofer ISE), day-ahead prices by market zone, January-June 2026 and August-October 2026, CC BY 4.0 license. Primary; newsroom analysis. https://api.energy-charts.info/price
  9. Ember, “European wholesale electricity price data” (monthly and daily, through October 29, 2026) and annual electricity data for Europe (file of June 17, 2026), CC BY 4.0 license. Secondary (analysis by a research center on ENTSO-E data); newsroom analysis. https://ember-energy.org/data/european-wholesale-electricity-price-data/
  10. German federal government, “Energy price relief measures take effect,” February 17, 2026. Primary. https://www.bundesregierung.de/breg-en/news/reduction-in-energy-prices-2358994
  11. Ministry of the Environment and Energy Security, National Integrated Energy and Climate Plan (PNIEC, the ministry’s document), final version, June 2024 (file of July 1, 2024), par. 4.5.3 (p. 419) and p. 171. Primary. https://www.mase.gov.it/portale/documents/d/guest/pniec_2024_revfin_01072024-pdf
  12. GME, Annual Report 2024 (move to the PUN Index GME from January 1, 2025; ITM indicator for combined-cycle plants, 61.4%). Primary. https://www.mercatoelettrico.org/Portals/0/Documents/it-IT/Gme_RelazioneAnnualeWeb_2024.pdf
  13. GME, Annual Report 2025 (June 2026; ITM indicator for combined-cycle plants, 52.5% in 2025). Primary. https://www.mercatoelettrico.org/Portals/0/Documents/it-IT/Gme_RelazioneAnnualeWeb_2025.pdf
  14. GME, glossary (marginal offer, equilibrium price, ITM indicator). Primary, undated. https://www.mercatoelettrico.org/en-us/Home/Glossary
  15. European Environment Agency (EEA), Briefing 18/2026, “Renewable electricity – best buffer against gas price volatility,” July 2, 2026. Primary (European Union agency). https://www.eea.europa.eu/en/analysis/publications/renewable-electricity-buffering-gas-prices
  16. Ministry of the Environment and Energy Security, note on the energy bills decree, October 16, 2026. Primary. https://www.mase.gov.it/portale/-/dl-bollette-pichetto-accordo-politico-preliminare-con-l-ue-
  17. Eurostat, gas prices for households (nrg_pc_202), second half of 2025 and first half of 2026. Primary; newsroom analysis. https://ec.europa.eu/eurostat/api/dissemination/statistics/1.0/data/nrg_pc_202
  18. ARERA, wholesale gas prices at the PSV, monthly average (table “Valore CMEMm – Servizio di tutela della vulnerabilità”), January 2024-September 2026. Primary; newsroom analysis. https://www.arera.it/area-operatori/prezzi-e-tariffe/valore-cmemm-vulnerabili
  19. World Bank, Commodity Price Data (Pink Sheet), updated October 2, 2026 (TTF, the price of gas in Europe). Primary; newsroom analysis. https://thedocs.worldbank.org/en/doc/74e8be41ceb20fa0da750cda2f6b9e4e-0050012026/related/CMO-Historical-Data-Monthly.xlsx
  20. EIA, “International LNG prices rise amid Strait of Hormuz closure,” April 28, 2026. Primary. https://www.eia.gov/todayinenergy/detail.php?id=67604
  21. ACER, “Key developments in European gas wholesale markets – summer 2026,” October 2026. Primary. https://www.acer.europa.eu/monitoring/key-developments-european-gas-wholesale-markets-summer-2026
  22. Al Jazeera, “Strait of Hormuz: What has happened since the US-Iran MoU on June 17?,” July 9, 2026 (the February 28 attack, the preliminary agreement, the end of the truce as declared by the U.S. president). Secondary. https://www.aljazeera.com/news/2026/7/9/strait-of-hormuz-what-has-happened-since-the-us-iran-mou-on-june-17
  23. Al Jazeera, “Shipping in Strait of Hormuz at a standstill despite US-Iran ceasefire,” April 10, 2026 (the pause in fighting in April). Secondary. https://aljazeera.com/economy/2026/4/10/shipping-in-strait-of-hormuz-at-a-trickle-despite-us-iran-ceasefire
Dark brown background with the title "Where the MASE's 14 billion comes from", "14 billion" in orange. Below, five horizontal blocks of different widths: four solid brown, one with only a dashed orange outline. Typography and shapes only.

Italy’s budget and energy: where the MASE’s €14 billion comes from

At 6:19 p.m. Rome time on October 28, 2026, the news agency ANSA ran this headline: “Mase, 14 billion in the Council of Ministers for energy transition and energy security” (my translation). The Council of Ministers (Cdm in Italian), Italy’s cabinet, which is the government and not Parliament, had ended at 4:56 p.m. I opened the official press release no. 195 of the Council of Ministers and looked for that number. As of the date I consulted it, October 29, 2026, it is not in the press release.

The 2027 budget package (the “manovra”) allocates resources to energy measures, that is, public money for railways, schools, hospitals and businesses, and that 14 comes from a note from the Ministry of the Environment and Energy Security (MASE), reported by the press. So where does it come from?

What the press release says

The press release mentions energy in several places and in none of them gives an amount for the energy measures. The budget package as a whole is worth about 26 billion euros in 2027 and 27 billion in 2028. The funding, meaning the money that pays for the spending, comes mostly from activating the clauses and from higher revenues, including those from the energy sector.

The clauses are the budget-flexibility ones. In practice, Italy can spend more than European rules usually allow, but with its own money: these are not EU funds. The sources use different names for the same mechanism: the press release calls it the “energy clause,” the ministry’s note and the newspapers call it flexibility, and Prime Minister Giorgia Meloni calls it the National Escape Clause (NEC), in Italian the “clausola di salvaguardia nazionale” (national safeguard clause). From here on I write just “clause.”

According to the European Commission, in its guidelines of August 17, 2026, the specific limits for energy security measures are 0.3% of gross domestic product (GDP) per year and 0.6% in total, for the period 2026-2028 and only for measures adopted after February 28, 2026. The eligible measures, the Commission writes, must be financed at the national level.

There is only one clause. According to the Ministry of Economy and Finance (MEF) and the daily Il Fatto Quotidiano, Italy requests it for two uses, energy and defense (the MEF writes “energy and security”), each worth about 0.3% of GDP per year. That is why in several sources the energy figures appear together with the defense ones.

For infrastructure the press release provides for “substantial resources,” in part but not only through the clause, with particular attention to railways and the road network. Other resources go to energy-efficiency upgrades (cutting the energy consumption of buildings) at hospitals, schools, universities, research institutes and sports facilities.

The measures are in the 2027 budget bill (the “ddl,” a bill that Parliament still has to pass), proposed by Economy Minister Giancarlo Giorgetti. I did not read the text: it does not appear to be published yet. ReteAgevolazioni writes that “The text of the DDL is not yet available,” and I did not find it on the websites of the government, the State General Accounting Office (Ragioneria generale dello Stato), the MEF and the Chamber of Deputies. The Senate’s site does not open.

The Ministry of the Environment and Energy Security, of which Gilberto Pichetto Fratin is minister, appears in the press release only spelled out, never with the acronym MASE. It appears, for example, in connection with a decree-law (an urgent measure that takes effect immediately and that Parliament must then convert into law) on the cost of electricity and gas that the Council, at the minister’s proposal, postponed: the press release does not say when it will come back for consideration or why.

The ministry’s note

The note is reported by at least seven outlets, including ANSA (“The ministry announced it”). The text, identical across several articles, is published in full by AGEEI without stating the source; only Ingenio gives the MASE press release as its source.

I could not read the note itself: the link that Rinnovabili places under the minister’s statements does not open (it returns a 404, page not found), and in the list of press releases on the MASE website, which I could open on October 29, I did not find it.

It opens like this: “More than 14 billion euros to support the energy transition.” They are, it continues, “MASE measures that fall within the perimeter of flexibility linked to energy,” approved by the Council of Ministers. The phrase may mean measures proposed by the ministry, within its remit, or managed by it: in the texts I read, the note does not distinguish, and it does not indicate the legal instrument.

According to the note, the line items are these:

  • Rail network: more than 5 billion.
  • Energy-intensive companies (“energivore” in Italian: large energy consumers): 2.5 billion.
  • Small and medium-sized enterprises (SMEs; “PMI” in Italian) that are not energy-intensive: 3.53 billion.
  • Solar photovoltaics: 1.2 billion.
  • Hydroelectric reservoirs: 800 million.
  • Biomethane: 700 million.
  • Schools: 650 million.
  • Hospitals: 600 million.
  • Universities, sports facilities and research centers: 250 million.

Adding up the line items, and counting more than 5 as 5, I get about 15.2 billion: more than 14, so consistent with the note’s total.

The 14 and the other numbers

“14” is not a single number. There are at least four different figures in the sources: about 29 billion over two years, 14.4 billion a year, 7.2 and 7. Here they are, with the source and date of each:

  • MEF (“Documento programmatico di finanza pubblica,” a public finance programmatic document; page dated October 6, 2026, which reports the request to activate the clause): resources “up to about 29 billion in the 2027-28 biennium,” for energy and security together.
  • Il Fatto Quotidiano (October 2, 2026): 14.4 billion of flexibility in 2027 and the same in 2028. In the body of the article, 14.4 billion is the annual total for energy and defense: 0.3% of GDP, that is 7.2 billion, for defense and another 0.3% for energy; the headline, however, speaks of 14.4 billion for energy and 14.4 for defense.
  • Energia Oltre (October 12, 2026): 7.2 billion for energy in 2027, without citing a source.
  • Avvenire (October 13, 2026): an informal note from Palazzo Chigi (the prime minister’s office) speaks of 7 billion for energy and 7 for defense in 2027.

The note’s 14 may resemble more than one of these figures. For example, doubling 7.2 I get 14.4, and adding the 7 for energy and the 7 for defense I get 14: two ways of arriving at a number close to the note’s. But no source links them to the ministry’s note, which does not say what period its 14 refers to.

AGEEI’s headline speaks of more than 14 billion from EU flexibility, and is easily read as European funds. I did not find the approval of the Council of the European Union: according to Avvenire, citing government sources, the procedure that activates the clause should be completed at the Eurogroup (the finance ministers of the euro area), convened for November 9.

Who manages what

One question remains: who manages these measures. Neither the press release nor the note, as the outlets report it, indicates which administration or which body will carry them out. In Meloni’s opening statement, the part of the press conference that I found transcribed on the government’s website, neither the 14 billion, nor the MASE, nor Minister Pichetto Fratin appears. I did not watch the video or read the statements of the other ministers.

But these spending items are not new. The press release speaks of railways and the road network and of energy-efficiency upgrades at hospitals, schools and universities, and Meloni says that the resources of the energy clause (she calls it NEC Energia) finance energy-efficiency upgrades at universities and hospitals.

For now the 14 has an origin, the ministry’s note, and an open question: who manages the resources. It remains to be seen how the bill will allocate the resources once the text is available.

Sources

Accessed October 29, 2026. All sources are in Italian; titles are given in the original. Quotations from them in the text are my translations. I mark the type of each source: official, institutional, press.

  1. Presidenza del Consiglio dei ministri, “Comunicato stampa del Consiglio dei Ministri n. 195,” October 28, 2026. Official. https://www.governo.it/it/articolo/comunicato-stampa-del-consiglio-dei-ministri-n-195/32973
  2. Presidenza del Consiglio dei ministri, “Conferenza stampa del Consiglio dei Ministri 195, l’intervento del Presidente Meloni,” October 28, 2026. Official; contains only the opening statement. https://www.governo.it/it/articolo/conferenza-stampa-del-consiglio-dei-ministri-195-lintervento-del-presidente-meloni/32969
  3. MASE note of October 28, 2026: not found on the ministry’s website (the Rinnovabili link returns a 404); text identical across several reports, including AGEEI (source 6). Official, not read.
  4. ANSA, “Mase, in Cdm 14 miliardi per transizione e sicurezza energetica,” Rome, October 28, 2026, 6:19 p.m. Press. https://www.ansa.it/sito/notizie/economia/2026/10/28/mase-in-cdm-14-miliardi-per-transizione-e-sicurezza-energetica_b0ed1ddb-947b-46fd-b35b-891419bbd117.html
  5. Teleborsa, “Energia, Mase: dal Cdm oltre 14 miliardi dalla flessibilità Nec,” October 28, 2026. Press. https://teleborsa.ansa.it/notiziario/economia/energia-mase-dal-cdm-oltre-14-miliardi-dalla-flessibilita-nec/
  6. AGEEI, “Manovra: MASE, oltre 14 miliardi da flessibilità Ue per sostenere transizione,” October 28, 2026, 8:20 p.m. Press; full text of the note, without stating the source. https://ageei.eu/manovra-mase-oltre-14-miliardi-da-flessibilita-ue-per-sostenere-transizione/
  7. MeteoWeb, Stefano Vitetta, “Energia, oltre 14 miliardi dal governo: 6 miliardi per le imprese, fondi per bollette, scuole, ospedali e rinnovabili,” October 28, 2026, 6:22 p.m. Press. https://www.meteoweb.eu/2026/10/energia-oltre-14-miliardi-dal-governo-6-miliardi-per-le-imprese-fondi-per-bollette-scuole-ospedali-e-rinnovabili/1001996358/
  8. Energia Oltre, Sebastiano Torrini, “Manovra, Mase: oltre 14 miliardi per la transizione, 3,53 miliardi alle PMI e 2,5 agli energivori,” October 28, 2026. Press. https://energiaoltre.it/manovra-mase-oltre-14-miliardi-per-la-transizione-353-miliardi-alle-pmi-e-25-agli-energivori/
  9. Ingenio, “Manovra, oltre 14 miliardi per la transizione energetica: risorse a imprese, rinnovabili ed edifici pubblici,” October 29, 2026. Press. https://www.ingenio-web.it/articoli/manovra-oltre-14-miliardi-per-la-transizione-energetica-risorse-a-imprese-rinnovabili-ed-edifici-pubblici/
  10. Rinnovabili, Erminia Voccia, “Via libera del Consiglio dei Ministri alla Manovra 2027, oltre 14 mld alla transizione energetica,” October 28, 2026. Press. https://www.rinnovabili.it/mercato/politiche-e-normativa/manovra-2027-legge-di-bilancio-energia-transizione-energetica/
  11. Ministero dell’Economia e delle Finanze, page “Documento programmatico di finanza pubblica,” October 6, 2026. Institutional. https://www.mef.gov.it/focus/Documento-programmatico-di-finanza-pubblica-00002/
  12. Commissione europea, Rappresentanza in Italia, “La Commissione adotta orientamenti sulla flessibilità di bilancio per le misure di sicurezza energetica,” August 17, 2026. Institutional. https://italy.representation.ec.europa.eu/notizie-ed-eventi/notizie/la-commissione-adotta-orientamenti-sulla-flessibilita-di-bilancio-le-misure-di-sicurezza-energetica-2026-08-17_it
  13. Il Fatto Quotidiano, Redazione Economia, “Ok del cdm al Documento di finanza pubblica. Giorgetti: ‘La manovra sia prudente’. Chiesti 14,4 miliardi di flessibilità per l’energia e 14,4 per la difesa,” October 2, 2026 (last updated October 3, 11:35 a.m.). Press. https://www.ilfattoquotidiano.it/2026/10/02/ok-del-cdm-al-documento-programmatico-di-finanza-pubblica-chiesti-14-miliardi-di-flessibilita-per-lenergia-e-14-per-la-difesa/8525986/
  14. Energia Oltre, Bianca Maria Togni, “Manovra, energia e flessibilità Ue: 7,2 miliardi per il 2027, Roma cerca margini contro i rincari,” October 12, 2026. Press. https://energiaoltre.it/manovra-energia-e-flessibilita-ue-72-miliardi-per-il-2027-roma-cerca-margini-contro-i-rincari/
  15. Avvenire, Marco Iasevoli and Gabriele Rosana, “Il governo approva lo ‘scheletro’ della manovra 2027, ma è tutto congelato sino a novembre,” October 13, 2026. Press. https://www.avvenire.it/politica/il-governo-approva-lo-scheletro-della-manovra-2027-ma-e-tutto-congelato-sino-a-novembre_114267
  16. ReteAgevolazioni.it, Franco Rasotto, “Legge di bilancio 2027: misure per le imprese e iter,” October 29, 2026 (updates through October 28). Trade press; does not give a bill number. https://www.reteagevolazioni.it/legge-di-bilancio-2027/
Dark brown background with the headline "AI amplifies those who look for flaws", "look for flaws" in orange. Below, sixteen vertical brown bars: one is a dashed orange outline, like a lever taken out. Typography and geometric shapes only.

Taking the brakes off a model like GLM-5.3 costs about $1,200, Anthropic estimates: who benefits?

About 600 hours of GPU computing and about $1,200. According to an estimate by Anthropic, that is what an experienced team starting from scratch would need to take away from GLM-5.3, a Chinese AI model, the ability to refuse harmful requests. Anthropic’s own attempt took about 2,200 GPU hours (GPUs are the graphics processors used for these computations), for about $4,400, largely spent trying out variants.

A model from which refusal has been removed is called “abliterated.” A model refuses certain requests because it learned to do so in training, but in 2024 a group of researchers, with Arditi as first author, showed that in 13 open-source chat models refusal depends on a single direction in the model’s internal space. It is like a machine in which a single control operates the brake: remove that one, and refusal no longer kicks in, and there is no need to retrain anything. The word “abliteration,” which does not appear in the paper, is used by Maxime Labonne in a Hugging Face post from June 2024.

Anthropic measures the difference in a report dated September 29, 2026. With 50 samples per condition, GLM-5.3 accepted explicit requests for offensive cyber operations in 0% of cases when the request was direct and in 100% in the abliterated version. Anthropic specifies that the simulations “are not perfect portrayals of real-world conditions”: no generated code is executed, so these are engagement rates (how often the model went along with the request) and not success rates of real attacks.

The same report also measures the original model. With a false cover story, posing as an autonomous red-team agent (the red team is the group that simulates attacks), engagement rises to 64%, and to 92% with a reasoning prefill (the model’s reasoning is started for it): refusal can be bypassed even without abliteration. Anthropic, which develops competing models, is an interested party. What remains to be understood is who benefits more, those who defend or those who attack.

Those who look for flaws

A first answer comes from those who look for flaws in order to report them. On October 21, 2026, Wiz, a cybersecurity company, published the PHP2Shell case, one of the four October cases I looked at: two critical flaws in PHP, a programming language used in websites. According to Wiz they had been in the code for decades and were found with the help of Wiz Atlas, one of the company’s own tools, and of the models Gemini 4 Argon and GPT-5.6 Sol.

For Wiz, which is describing its own work, the point is the barrier. Showing that those flaws could be exploited required a chain of steps at the limit of what human researchers could do, and “Frontier AI models substantially reduced that barrier, turning a longstanding flaw into an exploit.”

CISA, the U.S. cybersecurity agency, added the two flaws on October 26 to its catalog of exploited vulnerabilities. Sansec, picking up a report from Cloudflare, reports early attempts on October 21, but writes that mass exploitation is less likely than expected.

Those who look for flaws, after all, are not necessarily malicious. RFC 1392, an Internet glossary from January 1993, calls a hacker someone who delights in understanding in depth how a system works, and a cracker someone who tries to get into systems without authorization.

In its account of the intrusion it suffered in July, Hugging Face writes that the safeguards (guardrails) of commercial models accessed through APIs blocked the defenders’ work, because they cannot tell an incident responder from an attacker. Hugging Face hosts models of this kind and is therefore an interested party. For the analysis it used GLM-5.2, an open-weight model: one whose weights are published and can be downloaded, which is not the same as open source in the strict sense.

Abliterated versions of the Chinese models, meanwhile, appear quickly. According to Anthropic, several developers published abliterated versions of GLM-5.3 within days of its release: for these models it is the only primary-source evidence I found. For DeepSeek and Alibaba there are secondary reports. Pillitteri, a personal blog that links no primary sources, writes that the first versions of DeepSeek 4.1 Flash arrived a few hours after release, and CBS News reports that researchers at Tech Against Terrorism found abliterated versions of an Alibaba model within a day.

On capabilities there is an independent source, CAISI, a center of the U.S. National Institute of Standards and Technology (NIST). On September 17, 2026, it wrote that “GLM-5.3 is the most cyber-capable open-weight model released to date,” but that the model “lags the capability level of the U.S. frontier by about four months.” That lag concerns the original model: the page does not mention abliteration, and I did not find a measurement on the abliterated model. According to Anthropic, abliteration leaves capabilities substantially unchanged.

The real case and Hugging Face’s removals

There is a real case, and it is CrowdStrike’s, dated October 7, 2026. According to CrowdStrike, between late September and early October an unknown actor hit South Korean financial organizations with ARTEX, an open-source tool developed in China for penetration testing (intrusion tests), and able to act autonomously.

As its main model it used DeepSeek v4.1-flash, probably through a proxy or an API reseller, while GLM-5.3 and Grok 4.6 appear in other sessions.

According to CrowdStrike, AI can allow a financially motivated actor to carry out more intrusions in a short time. But the page does not say the models were abliterated, and it attributes the actor to a probable Chinese speaker, with moderate confidence and no known group. I looked for a real attack with an abliterated model and did not find one, though my search is not exhaustive.

Of the four cases, the use of AI models is declared only for PHP: for Node.js and Brotli the page lists “OpenAI Codex Security” among the reporters without saying how the flaw was found, and for WordPress 7.1.4 and Tailscale it says nothing on the matter. For none of the four did I find a documented link to Chinese or abliterated models.

What remained to be understood was what Hugging Face had done, and it is here that the starting idea did not hold up. I had started from the assumption that it had removed all these models. The sources say otherwise. One removal is confirmed: the repository penclaw-GLM-5.3-abliterated-for-offensive-cyber, from the Audn AI account, appears as disabled for violating the Content Policy, as the repository page says. On when this happened, the sources I read do not agree and the page has no date.

The Content Policy does not name “uncensored” or “abliterated” models, and the repository page does not say which clause was applied. Other disappearances reported online, such as that of the Kimi K2.7 Code repository, remain without a known cause, and for MiMo I could not verify anything. Meanwhile, on October 29 the search “abliterated” on Hugging Face returned 8,803 results: it is the search count, not a census, and it includes quantizations (compressed versions that run on smaller machines) and copies.

Hugging Face, in a note written to CBS by Yacine Jernite, says that it “conducts ongoing moderation and regularly acts on datasets, models, and Spaces that go against its content policy.” According to CBS’s summary, Jernite maintains that abliterated should not be equated with harmful, because a model that refuses can also block legitimate uses. I found no official statement on specific removals or on a general ban.

To the question I started from, the sources do not allow an answer. They document the help that models give to those who look for flaws, with U.S. models (the PHP case) and in controlled tests on GLM-5.3, and a real case on the attack side of which the page does not say whether the models were abliterated. What remains open is what will happen if the versions without refusals become easier to find or to stop. It remains to be seen how Hugging Face, the labs and the defenders will use these tools in the coming months.

A note before the sources: the newsroom I work with uses Anthropic models, and Anthropic is among the sources of this article. For this reason I attributed each of its claims and marked where it is an interested party.

Sources

Accessed October 29, 2026. I mark when a source is primary, a secondary report, or an interested party.

Page 1 of 2