
“They say inflation is 5%… but they’re lying.” That is how an Instagram carousel from the account angelogrecoofficial begins, the cover of a series of slides on grocery spending. Istat, Italy’s national statistics office, measured in October a rise in prices of 5.4% over one year; a poll, whose question the press accounts do not report, speaks instead of perceived inflation of 13.3%. Who is right?
To answer, I checked the carousel’s figures and set them beside the official data, in nine steps: from the carousel’s figures to the limits of the numbers.
I have already written about October’s prices, and about what rose in the shopping cart, in “Italy’s Inflation at 5.4%: What Costs More in the Shopping Cart”: I do not repeat it here.
What holds up in the carousel’s figures?
The carousel cites five numbers. Here is what can be checked, according to the data I gathered.
| Carousel figure | Verdict | What the sources say |
|---|---|---|
| October inflation +5.4% | True | Istat, provisional data, October 30, 2026 |
| Perceived price rises 13.3% | True as a poll result | the polling institute Noto Sondaggi for Il Sole 24 Ore (an Italian business daily), 2,000 people interviewed October 14-19; the press review and the news agency do not report the question or the method |
| Shopping cart +27.8% since the end of 2021 | Partly true | With Istat’s definition the shopping cart is at +25.6%; the 27.8% is close to the +28.1% for food alone |
| 52% changed their habits; 26% cut back on fish and seafood; 20% on red meat | Not checked | They are in the article in Il Sole 24 Ore, which is behind a paywall |
| Examples with 100 euros (105.40 with the 5.4%; “almost 128” with the 27.8%) | True | They are arithmetic |
The shopping cart, in Istat’s definition, includes food, household products and personal-care products. Il Sole 24 Ore has a basket of its own with 31 products (+29.5% from 2021 to 2026, according to ANSA, Italy’s leading news agency): which one is used for the 27.8% is not written in the carousel.
That leaves the word on the cover, “lying.” The carousel itself says, in its slides, that the 13.3% is a perception and does not replace Istat’s figure. The cover is harsher than the content.
What do we perceive, and what does Istat measure?
Istat calculates inflation with a price index for what people actually buy. Perception, by contrast, is measured by asking people. The European Central Bank’s (ECB) monthly survey of households, about 19,000 people in 11 euro-area countries, Italy included, asks people by how much, in their view, prices have changed over the past 12 months.
The answers are summarized in two ways. The median is the middle answer: half of the people say more, half say less. The mean adds everything up and rises when some people give very high values.
The ECB series and the spending-group series run through September 2026; October’s 5.4% is provisional. That is why the comparison is with Istat’s figure for the same month.
| Month | Perceived, median | Perceived, mean | Measured (Istat) |
|---|---|---|---|
| October 2022 | 11.2% | 17.3% | 11.8% |
| October 2023 | 10.1% | 15.4% | 1.7% |
| October 2024 | 4.9% | 8.1% | 0.9% |
| October 2025 | 5.0% | 9.1% | 1.2% |
| September 2026 | 5.0% | 9.0% | 4.2% |
Three things come out of it:
- In 2022, at the peak of prices, the “typical” person perceived almost exactly the measured inflation: 11.2% against 11.8%.
- Today the gap is small: 5.0% against 4.2%. It was only this small in October 2022; in the other months of the table it was almost 4 percentage points or more.
- In between, perception fell much more slowly than prices: in October 2023, 10.1% against 1.7%.
The poll’s 13.3% from Noto and the ECB’s 5.0% cannot be set side by side without caution. They are two different surveys, with different questions and samples. If the 13.3% were a mean, and that is not stated, the right comparison would be with the ECB’s 9.0%.
Why did perception stay high in 2024 and 2025?
In 2024 and 2025 measured inflation was 1.3%, on average over the months. Median perception was about 5%: about four times higher. It is the figure that surprises most.
One possible explanation is the memory of prices. Inflation that slows down does not bring prices back down: it makes them grow more slowly from a level that is already higher. Anyone who remembers what groceries cost in 2021 keeps seeing a more expensive receipt, even when the rise over the last year is small.
This is an interpretation: the ECB data do not measure it. They say that perception stayed high; they do not say why.
An example shows why the two numbers can coexist. “Slowing down” does not mean “costs less”: if a product goes from 100 to 120 euros and the next year rises by 2%, it costs 122.40. The rate is low, the price is higher than before.
How much have prices risen since the end of 2021?
From the end of 2021 to October 2026 the rise in prices, according to Istat’s indexes, is this:
- General index (the NIC, the price index Istat uses every month for “official” inflation; everything that is bought): +21.4%.
- Shopping cart (food, household products and personal-care products): +25.6%.
- Food only: +28.1%.
I calculated the changes from Istat’s indexes.
In practice, what cost 100 euros in the shopping cart at the end of 2021 costs about 126 today and, if it is only food, about 128. Il Sole 24 Ore’s +27.8% sits in between, closer to food than to the shopping cart. The carousel is not far off: the definition matters.
Since December 2021 prices are 21.4% higher (25.6% in the shopping cart): it is the rise in the level of prices, not a measure of perception over the last 12 months.
Istat publishes two price indexes: the NIC, the one for each month’s inflation, and the HICP, the EU-harmonized index of consumer prices, calculated with the same rules across Europe so that countries can be compared. They measure the basket in slightly different ways and give slightly different results: I use the NIC for general comparisons and the HICP for groups of households. (For U.S. readers: the NIC is Italy’s national consumer price index for the whole population, the Italian counterpart of the CPI; it is not the U.S. CPI.)
Is the average the same for all households?
No. Istat also publishes inflation for groups of households. It divides households into five groups of equal size according to how much they spend, taking into account how many people are in the household, and for each group it calculates an index with the weights of its spending. Here I use the HICP, which Istat publishes for these groups.
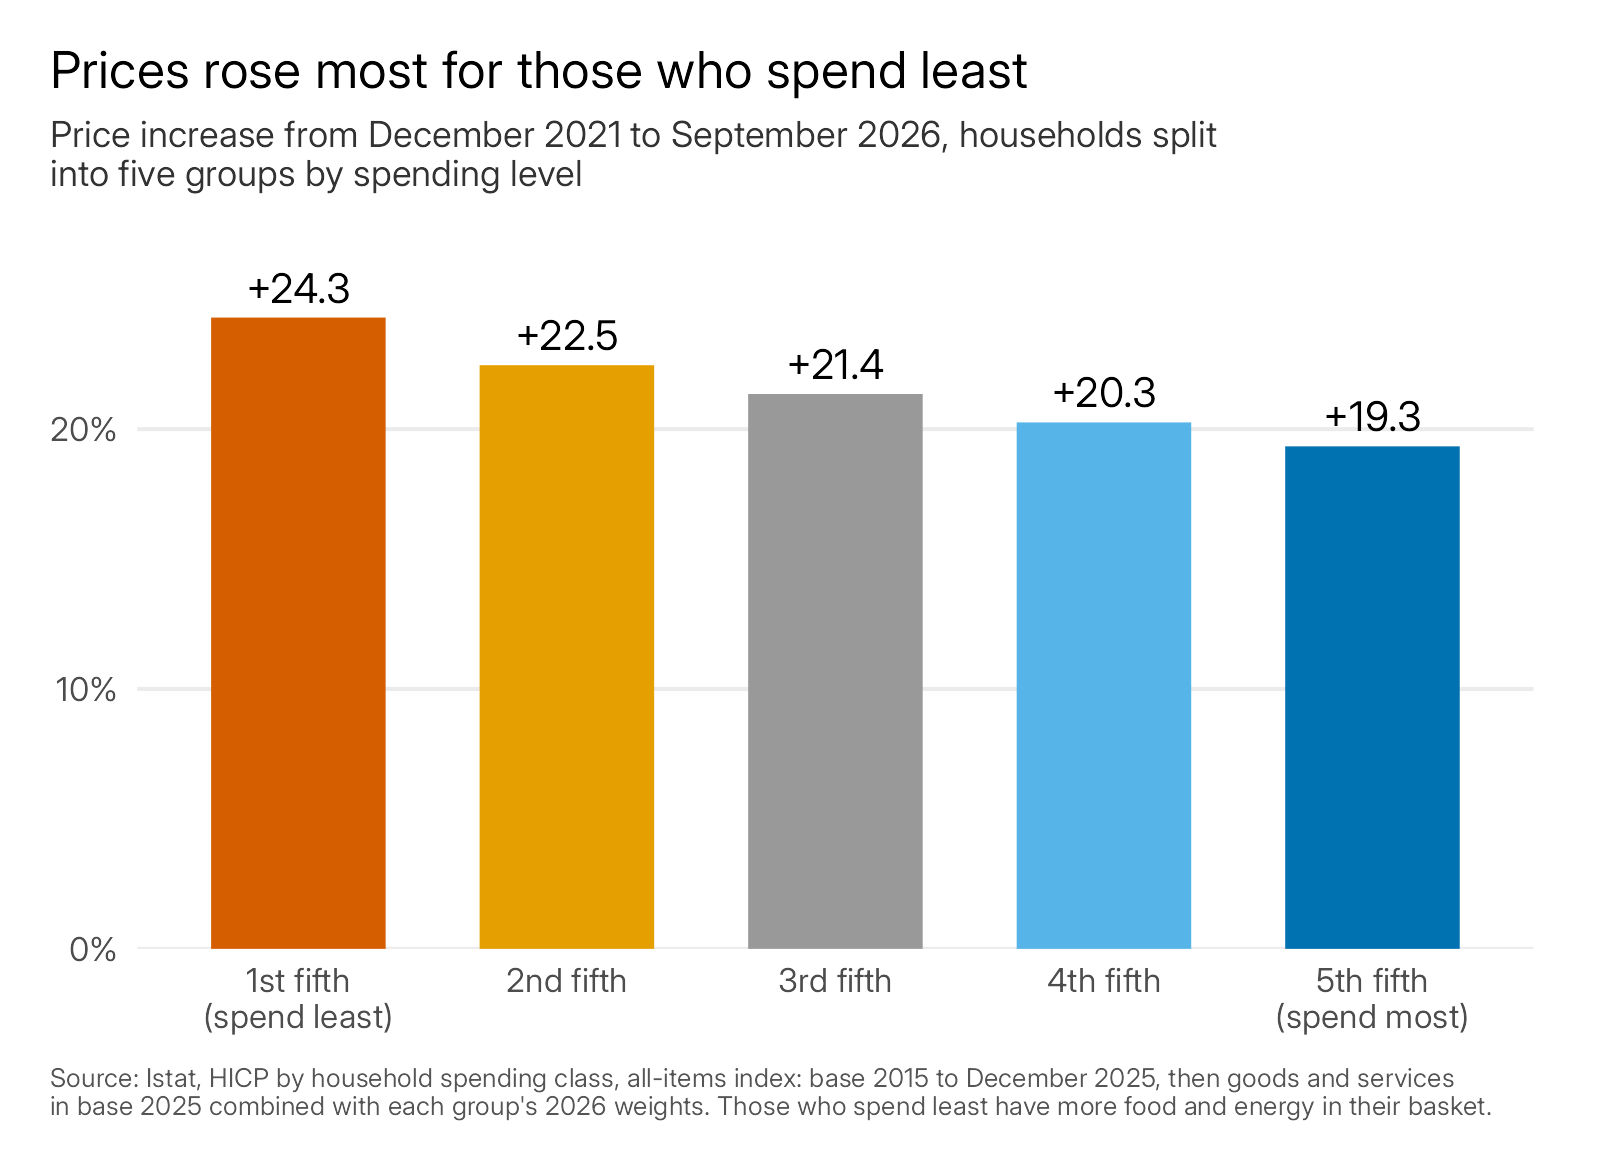
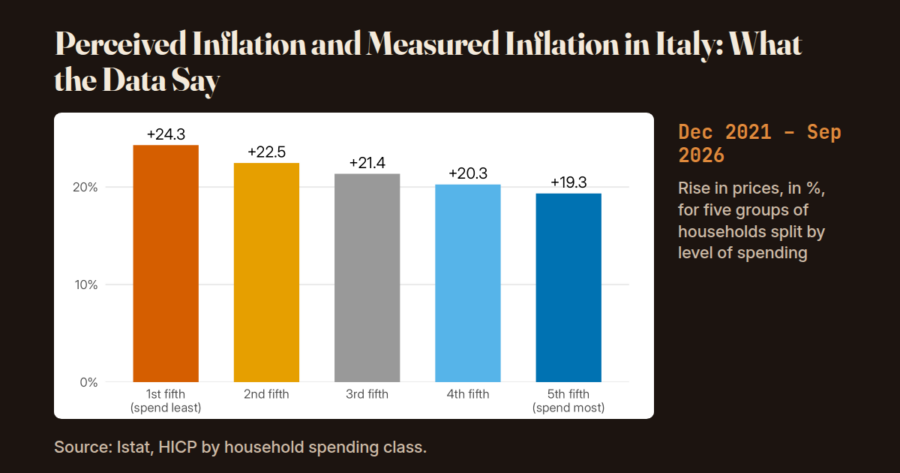
From the end of 2021 to September 2026 prices rose by 24.3% for the fifth of households that spends the least and by 19.3% for the fifth that spends the most (Istat, indexes by spending group). The gap is 5 percentage points. For comparison, the HICP for all households, over the same period, is +20.9%.
In 2022, the worst moment, inflation was 18.6% for the households that spend the least and 9.9% for those that spend the most (October 2022, compared with a year earlier; with the other index, the NIC in the table above, it was 11.8%; the HICP for all households was 12.6%).
The reason is in the basket, that is, in the list of products and services that people buy and that the index measures: for the households that spend the least, energy accounts for 17% of spending, for those that spend the most 7% (Istat, 2026: how much each item weighs in household spending). The carousel senses it in its own words (“if prices rise mainly on the things you can’t do without, your budget can suffer more than the average figure suggests”): here is the number.
It is not always so. In 2024, when energy fell, the households that spend the least had less inflation than the others: 0.1% against 1.6%, annual averages from Istat.
The average describes the whole; it does not say how each group is doing.
What about contractual wages?
To understand whether spending weighs more, one also has to look at how much people earn. Istat publishes contractual wages per employee, that is, the minimums set by national labor contracts: they are not actual salaries.
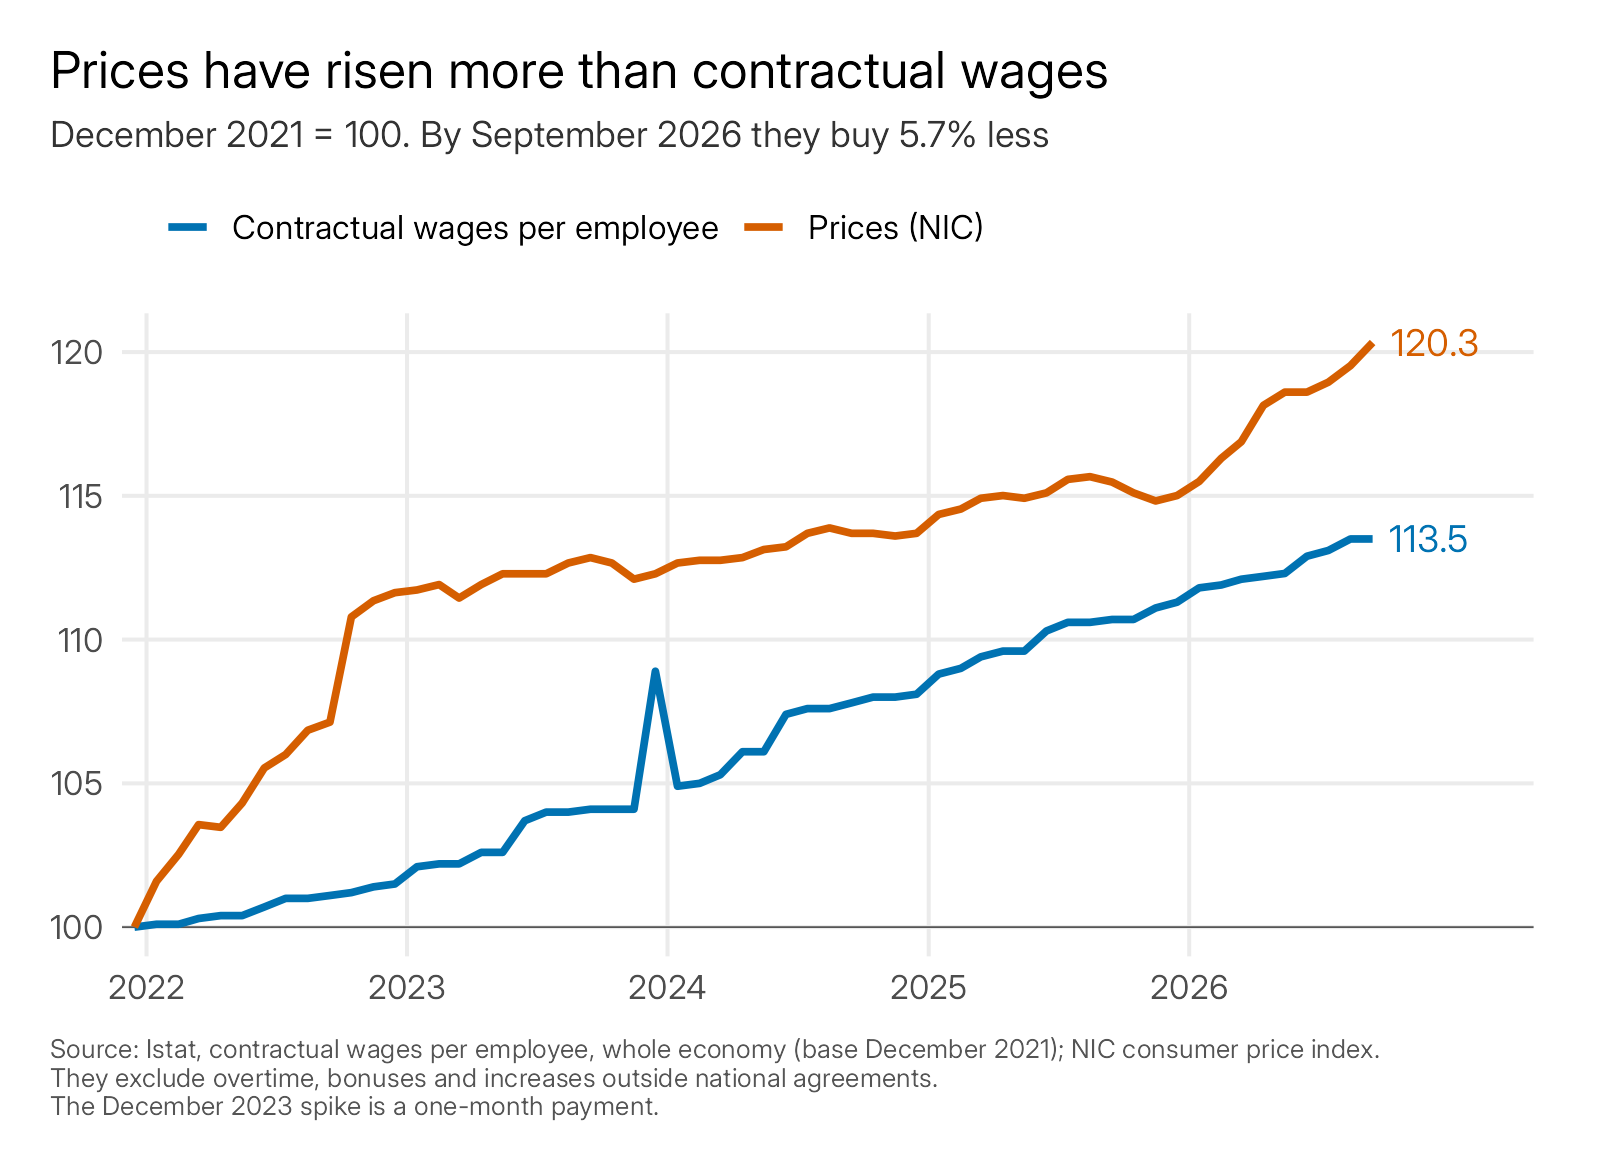
From December 2021 to September 2026, the latest month available for wages:
- Contractual wages: +13.5%.
- Prices (NIC, the index Istat uses for each month’s inflation): +20.3%.
With the NIC, purchasing power, that is, how much one can buy with the same wage, is down 5.7%; with the HICP, the index used for the spending groups, 6.2%. The lowest point was December 2022 (−9.1%): since then wages have recovered in part, but in 2026 prices have started to run again.
Two limits, each tied to the data. The comparison starts in December 2021, the carousel’s date and the point just before the 2022 climb: with a different starting date the result would change. And contractual wages do not include overtime, company bonuses and raises outside the national contracts: actual wages may be somewhat different.
What do the cutbacks say?
The carousel asks its readers: “what did you have to give up?” The closest official figure comes from Istat, in its report on household consumption expenditure for 2025.
- 29.4% of households limited their spending on food, reducing quantity or quality: almost three in ten. In 2024 it was 31.1%: the share has fallen.
- Clothing and footwear: 43.8% of those who buy them limited their spending; in southern Italy (the Mezzogiorno), 52.1%.
These are 2025 figures, and so predate the rise in inflation in 2026. They are not comparable with the carousel’s 52%, whose question is unknown: the two numbers measure different things.
What do the numbers say, taken together?
Lined up, the data say things that the carousel and the headlines leave separate:
- The 5.4% is true, as an average of the prices of what households buy.
- Perception follows prices at the peak and stays higher than measured inflation when prices slow. In 2022 the typical figure was close to Istat’s (11.2% against 11.8%); in 2024-2025 it was about four times higher (about 5% against 1.3%, monthly averages). The ECB data do not say why.
- The average hides the differences. For the fifth of households that spends the least, prices have risen by 24.3% since the end of 2021, for the fifth that spends the most by 19.3%: a gap of 5 points.
- Since December 2021, contractual wages have grown less than prices, on average: purchasing power is at −5.7%.
So “lying” does not hold up: the 5.4% is a true average. But an average does not say how each household is doing. The data on spending groups show that those who spend less have seen prices rise more, and the data on contractual wages that they have risen less than prices. Why perception stays higher than measured inflation, however, the data do not say.
What can’t the numbers say?
Three limits, to keep in mind.
- The Noto poll. The question and the method do not appear in the accounts that could be read; the Il Sole 24 Ore article is behind a paywall. The 13.3%, the 52%, the 26% and the 20% remain unchecked figures.
- Wages. They are only those of the national contracts, and they do not say what each person earns.
- Why perception stays high. That it is the memory of earlier prices is a reasonable hypothesis; the ECB survey does not measure it.
All that remains is to see, in the coming months, whether perception will follow prices when they slow, as it did not in 2024 and 2025.
Frequently asked questions
Is inflation really at 5.4%?
Yes, according to Istat, inflation in October 2026 is 5.4% compared with October 2025: it is a provisional figure, and Istat publishes the final one on November 17. It is an average of the prices of what people buy, so it does not coincide with what each household feels.
What is the difference between perceived inflation and measured inflation?
Measured inflation is the one Istat calculates from hundreds of thousands of prices collected every month. Perceived inflation is the one people state in surveys. In September 2026, in the ECB survey, median perceived inflation in Italy was 5.0% and measured inflation 4.2%.
How much have prices risen since the end of 2021?
According to Istat’s indexes, in October 2026 prices are 21.4% higher than in December 2021. The shopping cart is at +25.6% and food alone at +28.1%. These are changes in the level of prices over time, not the inflation of the last 12 months: they say how much more what cost something at the end of 2021 costs today. The shopping cart includes food, household products and personal-care products.
Have households that spend less had bigger price increases?
Yes, according to Istat, but the gap is 5 points: from December 2021 to September 2026 prices rose by 24.3% for the fifth of households that spends the least and by 19.3% for the fifth that spends the most. One reason is in the basket: for those who spend less, energy accounts for 17% of spending, for those who spend more 7% (Istat weights, 2026).
Have wages grown as much as prices?
No: from December 2021 to September 2026 contractual wages rose by 13.5% and prices by 20.3%. Purchasing power is down 5.7%, according to Istat. They are the minimums of the national contracts, not every salary. Purchasing power is the quantity of goods one can buy with the same wage.
Download the data and the code
I have gathered in a zip file the data and the code with which I redid the calculations, so that anyone who wants to can repeat the analyses. Inside are the processed tables in CSV files, that is, plain-text tables (perceived and measured inflation, spending groups, contractual wages), the scripts that redo the calculations and draw the two charts, written in R, a language for data analysis, and a file of instructions. The original Istat and ECB data are not in the file: they can be downloaded from the sites listed in the sources. Download the data and the code for the analysis (zip): 22 KB (22,474 bytes), file dated November 3, 2026, SHA-256 c6650d2f7cce075d26d28ee73ee0a922484fbafdd54166d0b098761b65fc27b7.
Method note (for those who want to check the math)
The changes since 2021 are calculated on the NIC, the consumer price index for the whole population, Istat series by type of product (2015 base through December 2025, 2025 base from 2026, linked on the 2025 average). The spending groups use the HICP: for each group Istat calculates an index with the weights of its spending, drawn from the household expenditure survey. For 2026 Istat publishes for each group the index for goods and the one for services, not the general index: I combined them with the 2026 weights of each group, as is done for a harmonized index, with an estimated error of about 0.1 points (redone on 2025, where the general index exists, the error is at most 0.11). The comparison through December 2025 is entirely Istat data: +18.3% for those who spend least and +15.0% for those who spend most. With the HICP for all items, official through December 2025 and for 2026 derived from goods and services with the 2026 weights, the rise in prices from December 2021 to September 2026 is +20.9% and purchasing power −6.2%. As a check I compared the shopping cart in the 2025 average with the 2021 average: +24.0%, which matches the Istat figure reported by ANSA in January.
The comparison between perceived and measured inflation uses for the ECB survey the median and mean series for Italy; measured inflation is Istat (NIC) for the same month. The 2024-2025 average of median perception is 5.4% and that of measured inflation 1.3%: they are averages of the monthly data.
The December 2023 spike in wages is a one-month payment. The data were downloaded on November 2, 2026 (the spending groups and the weights on November 3); the R code is in the zip file.
Sources
Accessed November 2 and 3, 2026. I mark the type of each source: primary (whoever produces the data), derived (calculated from primary data), secondary. Titles of Italian sources are in the original, with an English translation in brackets. Quotations from Italian-language sources are my translations.
- Istat, release “Prezzi al consumo, dati provvisori ottobre 2026” [“Consumer prices, provisional data October 2026”], October 30, 2026. Primary. https://www.istat.it/comunicato-stampa/prezzi-al-consumo-dati-provvisori-ottobre-2026/
- Istat, database (NIC by type of product; HICP by household spending group and the related 2026 weights; contractual wages), accessed November 2 and 3, 2026. Primary; derived from primary data. https://esploradati.istat.it/
- ECB, Consumer Expectations Survey, household survey, series for Italy (median and mean 12-month perceived inflation). Primary. https://data.ecb.europa.eu/data/datasets/CES
- Istat, “Le spese per i consumi delle famiglie, anno 2025” [“Household consumption expenditure, 2025”], October 8, 2026, p. 4. Primary. https://www.istat.it/wp-content/uploads/2026/10/REPORT_Spese-per-consumi-2025.docx.pdf
- Eurostat, harmonized indices of consumer prices (prc_hicp_midx), for the check of the HICP for all households. Primary. https://ec.europa.eu/eurostat/databrowser/view/prc_hicp_midx/default/table
- Instagram, account angelogrecoofficial, carousel with the cover “Dicono che l’inflazione è al 5%… ma mentono” [“They say inflation is 5%… but they’re lying”], 11 slides, read on November 2, 2026. Secondary. https://www.instagram.com/p/DfOrokvCGIz
- Noto Sondaggi for Il Sole 24 Ore, poll of October 14-19, 2026 (2,000 interviews), front page of November 2, 2026, read through a press review and the news agency. Secondary; the question and the method do not appear in the accounts that could be read.
- ANSA, “Italy’s shopping trolley price index has risen 24% since 2021,” January 16, 2026, https://www.ansa.it/english/news/2026/01/16/italys-shopping-trolley-price-index-has-risen-24-since-2021_1710747e-9bd0-485b-9e85-b22bc675c1cd.html ; ANSA, “In Italia carrello della spesa più caro del 29,5% in 5 anni” [“In Italy the shopping cart is 29.5% more expensive in 5 years”] (Il Sole 24 Ore basket), August 31, 2026, https://lavocedinewyork.com/ansa/2026/08/31/in-italia-carrello-della-spesa-piu-caro-del-295-in-5-anni/ (copy of the agency’s report). Secondary.